Get Started
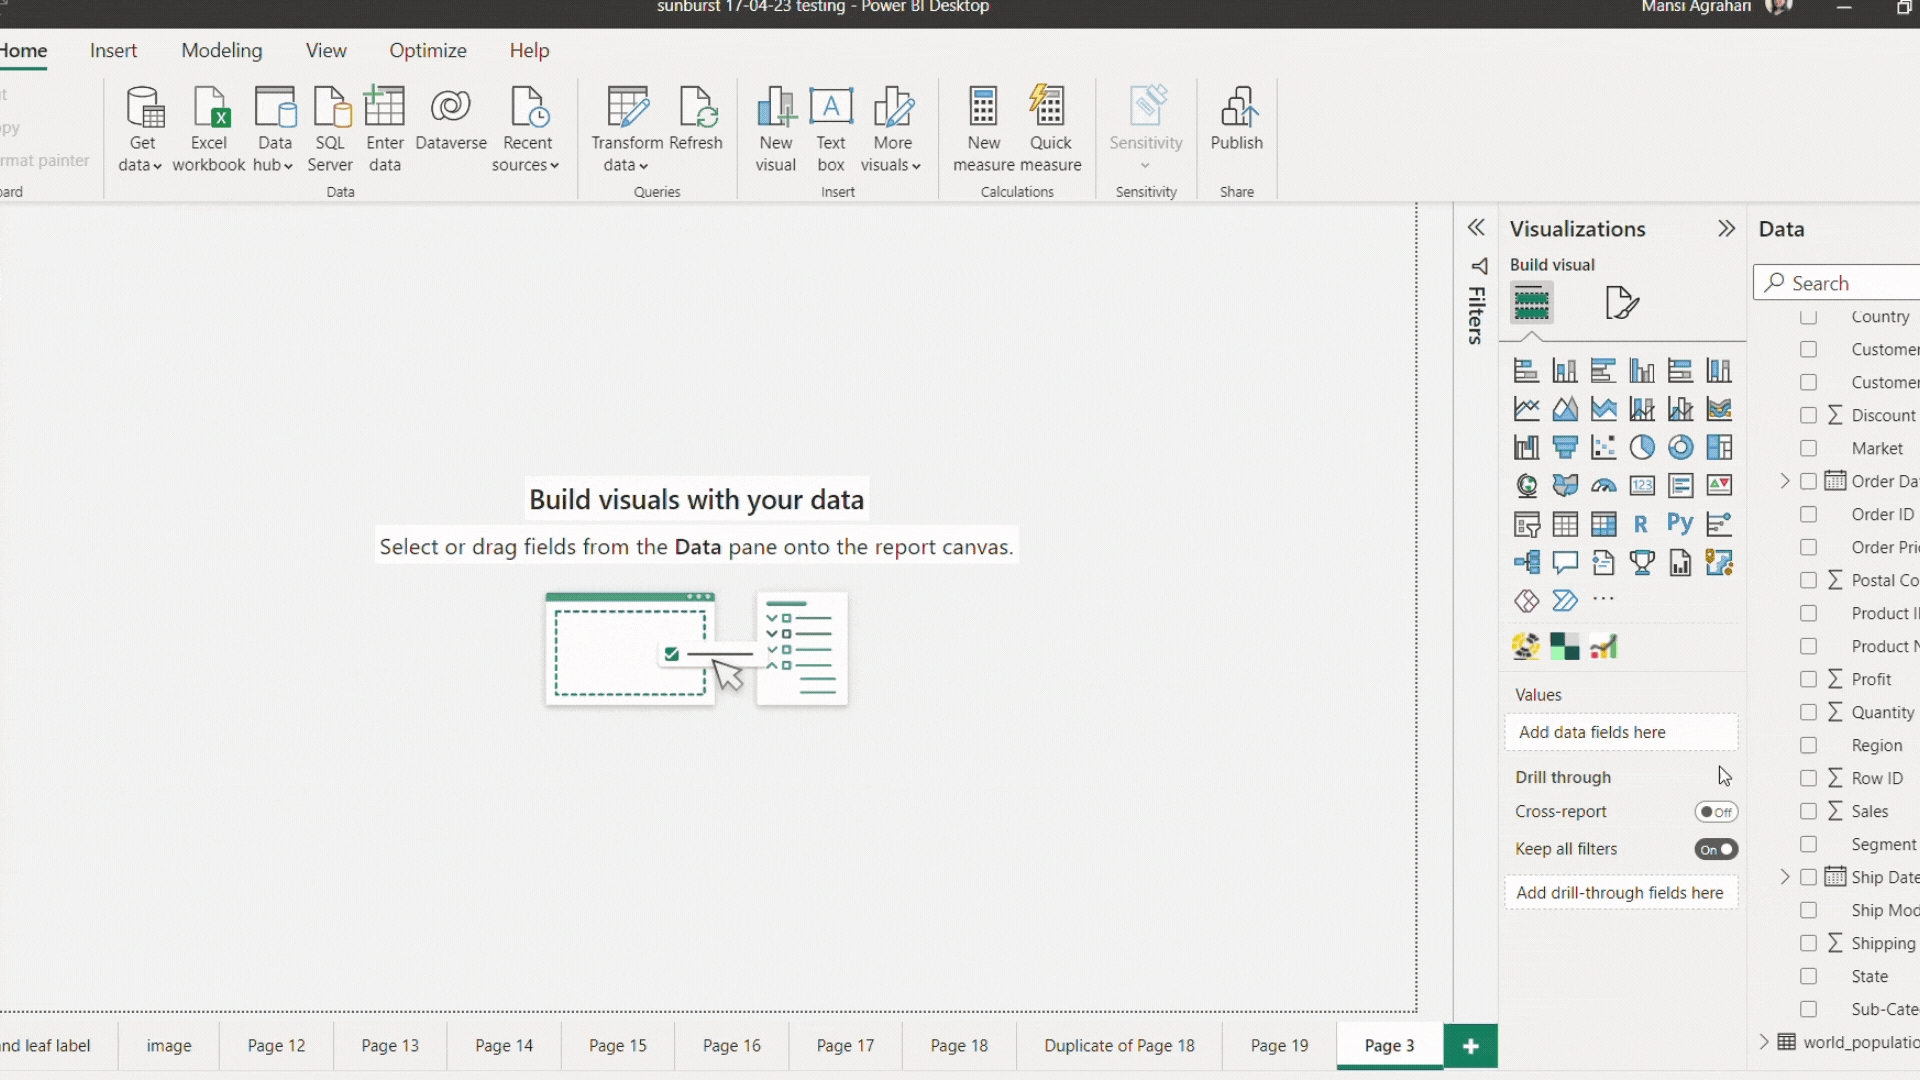
The Powerviz Sunburst Visual is easy to configure. In this section, you will learn how to create an advanced sunburst chart. Installation GuidesInstallation Guides contain the installation process and instructions on Sunburst Visual. Please note that the installation process is the same across all the visuals. You can see the user guide here. StepsNow that you've successfully installed Powerviz Sunburst visual to Power BI, let's start making the chart. Follow the below steps to start the sunburst visual.
Steps
Description
1
Select the Sunburst visual from the visualization pane.
2
Add at least one Dimension into the Category field.
3
Add one Metric into Measure field.
4
To create a hierarchy, insert multiple dimensions in the category field from top to bottom, with the top column being the parent node and the others its child nodes.
Finish
Powerviz Sunburst is now ready. By default, it shows the top five categories with show remaining as "others."
INFO
Use advanced settings to customize all the options in the sunburst except legends and number formatting.

Field Requirements
A sunburst visual is used to show the hierarchy relationship. Hence, creating a sunburst visual required one metric and as many dimensions as possible. Sunburst will divide each level proportionally to its parent node. We have the following fields available in the Sunburst field tab:
Category: All the hierarchy dimensions should be dragged in the category field from top to bottom order so that the parent node is at the top and the child nodes are at the bottom. You can add as many dimensions in the Category field.
Measure: In the measure field, only one measure/numeric-type column can be added, and this value is used to divide the arcs.
Images: The sunburst visual allows us to show images at the outer circle. To add images, you’re required to have an Image URL property-type column. Drag the column into the Images field. If the URLs are correct, the images will appear on the screen. Only one column can be added to this field.
Tooltip: It is a Power BI native option, you can use it to show additional information about each category on the tooltip. You can also use the tooltip to apply measure-type conditional formatting.
Sort: Apply sorting based on any custom column. Drag the column into the Sort field and use the Sorting from advanced settings to select the sorting order.
Show: This option allows you to control the visual rendering based on a specific rule. You need to add a boolean-type (0 or 1) column or measure. If the output is 1, the visual will be visible; otherwise, the visual will show the error message. To know more about this option, read this section on Show condition.
Last updated