Introduction
The Powerviz Rose/Donut/Pie Chart is a highly customizable visual with advanced features. It is 4 in 1 type visual that offers:
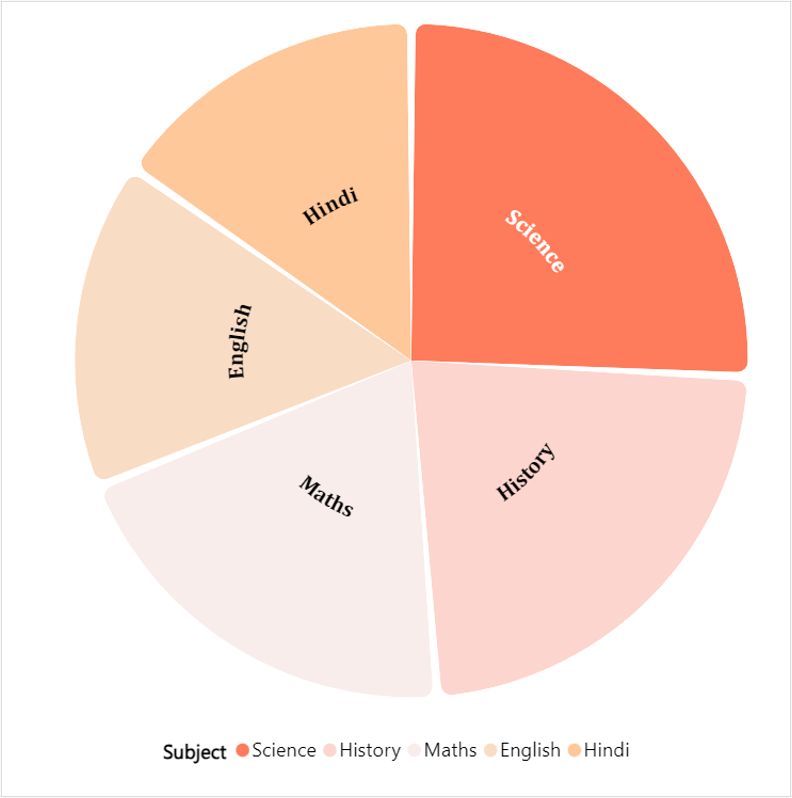
Rose Pie Chart
Rose Donut Chart
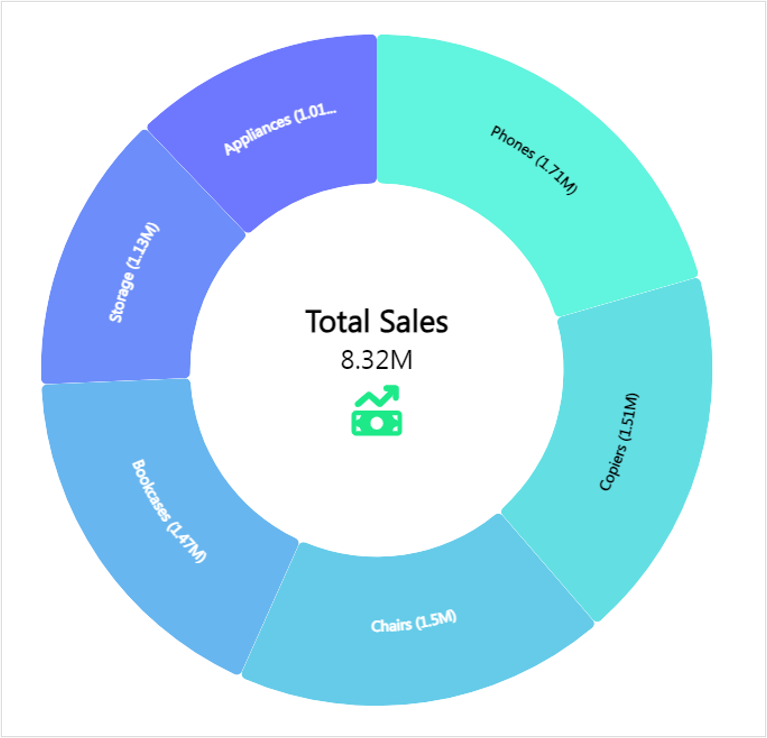
Donut Chart
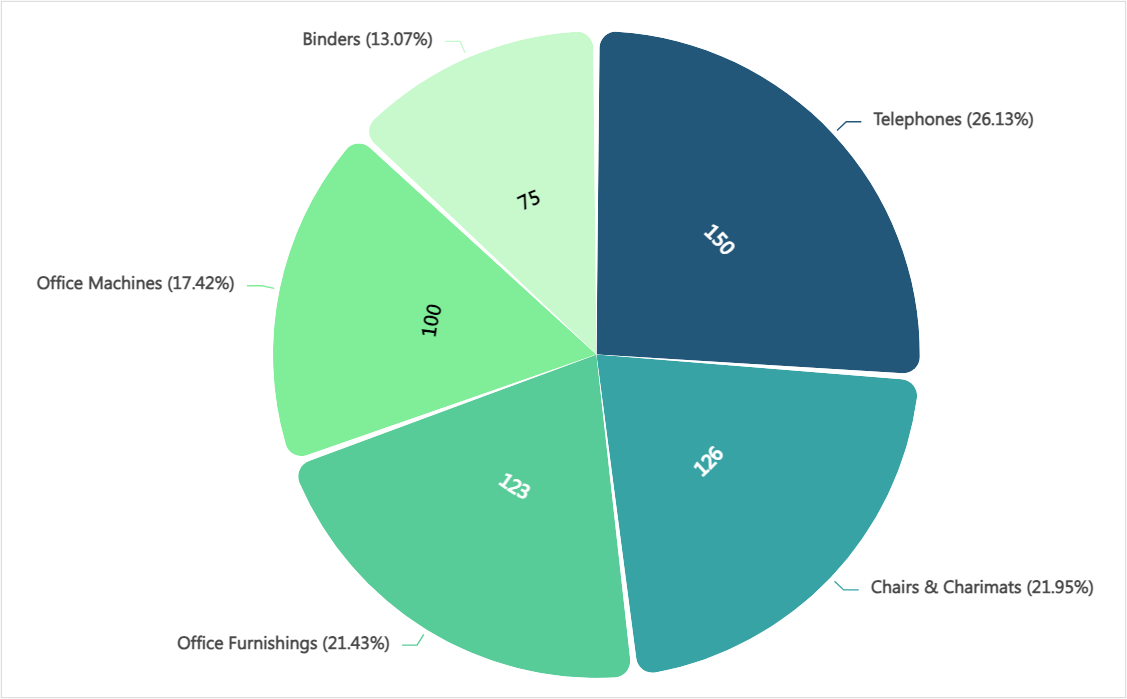
Pie Chart
Pie/donut charts are commonly used to show the "part to whole" type data where each segment's size relates to the respective category.
Rose chart also commonly known as variable chart is a form of donut chart where the height of each arc is defined by a measure. This creates a rose-type effect where height and radius both vary in the visual. All these charts make the data analysis simpler and easy to understand.
Powerviz Rose/Donut/Pie chart is a Power BI custom visual available at AppSource.
This documentation will help you get started with the Rose/Donut/Pie chart by explaining everything you need to know about it. If you're new to our site, check out the visual library for other visuals that meet your requirements.
Powerviz Rose/Donut/Pie chart highlights include:
Customize the Rose/Donut/Pie chart into different
chart styleandchart types.Select colors from
7 schemesand30+ palettes.Use the
fill patternto customize the arcs in the chart.Add
data labelsinside and outside.Add
center circleandmouseover descriptionto make chart more informative.Conditional formattingandrankingare supported.Easily apply
outside and inside images.Additional features include
grid view,annotation, andshow condition.
Follow this guide to have an in-depth view of the Powerviz Rose/Donut/Pie chart. To know more about other Powerviz visuals and slicers, visit our library or contact us directly for a demo.
Examples


Last updated