Introduction
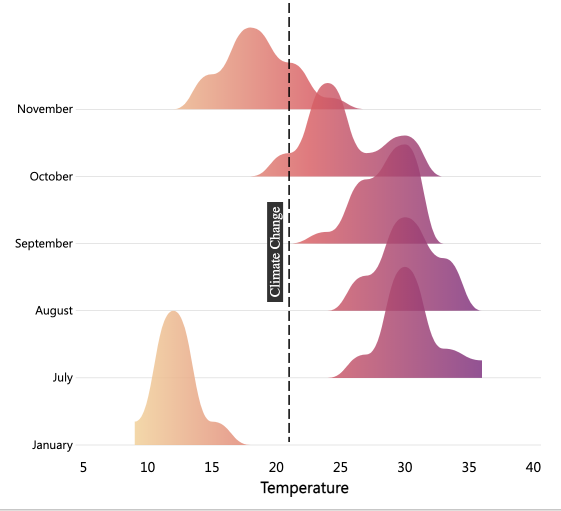
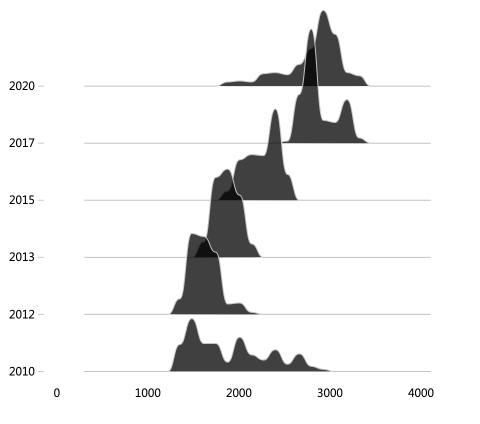
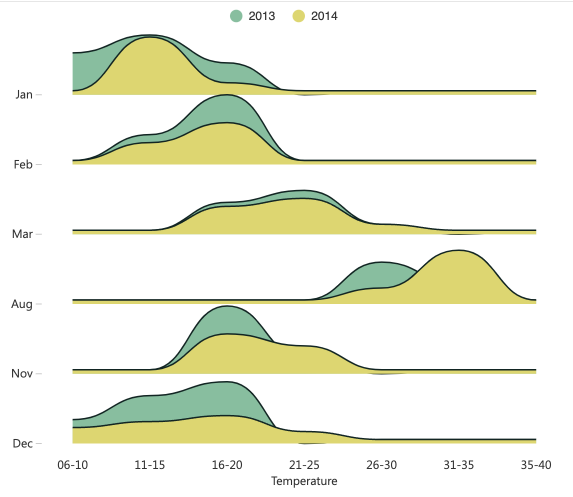
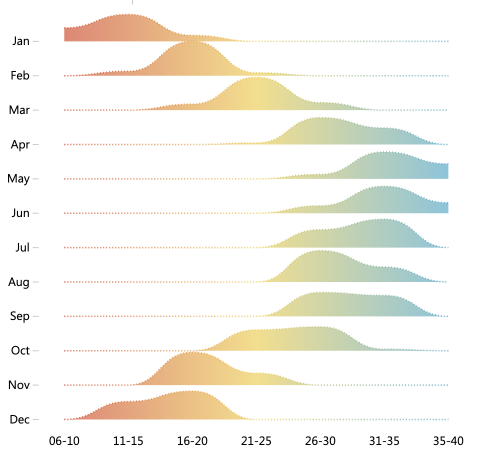
Powerviz Ridgeline Plot is a chart used to visualize trends and patterns in the distribution data for multiple categories along a common continuous axis. The overlapping mountain ranges allow easy comparison by saving whitespace on your report. It is available for download on AppSource & directly from the website. With Powerviz, experience these advanced features with multiple values, scaling, legends, conditional color formatting, annotation, custom tooltips, and more.
This documentation will help you get started with Ridgeline by explaining everything you need to know about it. If you are new to our site, check out the visual library for other visuals that meet your requirements.
Powerviz Ridgeline Plot highlights include:
Ridgeline: Customize the ridgeline area,stroke, &markers.Display Style: Choose from a variety of curvature styles -
natural,linear, andstep- to effortlessly create impactful designs.Apply
colorsin different ways – by axis, category & multiple values.Customize with a wide range of options, including 7 vibrant color schemes and over 30 stunning palettes to choose from. In addition, apply
conditional formattingrules.Control the
overlapping& scaling of the Y-axis with precision.Use
mode linesto highlight the peak points with a single click.Add
reference lineson the Y-axis and X-axis to highlight a range or a data point.Choose from a wide range of pre-designed
patternsor upload your own design.Ranking,sorting, gridlines & other such features are available too.Create custom
themes& save them in JSON file.
Follow this guide to get an in-depth view of Powerviz Ridgeline. To know more about other Powerviz visuals, visit our library or contact us directly for a demo.
Examples


Last updated