Powerviz
  • Introduction
  • Installation Guide
    • Install from Appsource
    • Import through file
    • Adding the Powerviz visuals as Organization visuals
  • Date Picker
    • Introduction
    • Get Started
    • Format Pane
    • Advanced Settings: Introduction
      • Calendar
      • Formatting
      • Date Picker Button
      • Default Selection
      • Date Selector
      • Presets
      • Selection Controls
      • Date Range
      • Invalid Dates
      • Weekends/Holidays
    • Themes
      • Default Theme
      • Custom Theme
  • Sunburst
    • Introduction
    • Get Started
    • Format Pane
    • Advanced Settings: Introduction
      • Chart Options
      • Data Colors
      • Fill Patterns
      • Arc Settings
      • Labels
      • Sorting
      • Ranking
      • Center Circle
      • Leaf Label Images
      • Conditional Formatting
      • Show Condition
      • Annotations
      • Grid View
    • FAQ
  • KPI
    • Introduction
    • Get Started
    • Format Pane
    • Edit Mode - Introduction
      • KPI Charts
        • Advanced Text
        • Bar Chart
        • Lollipop Chart
        • Line Chart
        • Area Chart
        • Combo Chart
        • Donut Chart
        • Pie Chart
        • Linear Gauge
        • Liquid Gauge
        • Radial Gauge
        • Bullet Chart
        • Waterfall Chart
        • Icon
        • Image
        • Shape
      • Templates
      • Small Multiples
      • Actions
      • Import/Export
  • Activity Gauge
    • Introduction
    • Get Started
    • Format Pane
    • Advance settings: Introduction
      • Gauge Options
      • Target
      • Data Colors
      • Fill Patterns
      • Labels
      • Ranking
      • Sorting
      • Center Circle
      • Mouse Over Text
      • Conditional Formatting
      • Show Condition
      • Grid View
      • Annotations
  • Funnel Chart
    • Introduction
  • Horizon Chart
    • Introduction
  • Ridgeline Plot
    • Introduction
  • Rose/ Donut/Pie Chart
    • Introduction
  • Word Cloud
    • Introduction
    • Get Started
    • Format Pane
    • Advanced Settings: Introduction
      • Word Options
      • Data Colors
      • Shapes
      • Text Style
      • Direction
      • Ranking
      • Exclude
      • Conditional Formatting
      • Show Condition
      • Grid View
      • Lasso and Reverse Lasso
  • Linear Gauge
    • Introduction
  • Filter
    • Introduction
    • Get Started
    • Format Pane
    • Advanced Settings - Introduction
      • Filter Settings
      • Cell Style
      • Cell Colors
      • Title Bar
      • Column Headers
      • Image Styling
      • Default Selection
      • Conditional Formatting
      • Import/Export
      • Templates
  • Lollipop Chart
    • Introduction
  • Heatmap
    • Introduction
    • Get Started
    • Format Pane
    • Advanced Settings: Introduction
      • Shapes
      • Data Colors
      • Data Labels
      • Axis Settings
      • Grid Lines
      • Sorting
      • Plot Area
      • Reference Lines
      • Ranking
      • Totals
      • Small Multiples
      • Conditional Formatting
      • Show Condition
      • Grid view
      • Lasso and Reverse Lasso
  • Network Graph
    • Introduction
  • Sankey Chart
    • Introduction
Powered by GitBook
On this page
  • Visual Settings​
  • General Settings​
  1. Date Picker

Format Pane

PreviousGet StartedNextAdvanced Settings: Introduction

Last updated 11 months ago

This section consists of all the settings and formatting options that fall under the “Format” pane offered by Powerviz. It includes settings like title, background, and others. If you want to know about advanced settings, read this .

Table of Content

The format pane is divided into 2 sections – Visual and General

Visual Settings

Powerviz License

Once you've joined Powerviz, you'll have access to all the visuals in the library. You have received your credentials, which you must enter here to use the pro version.

Click here for more information about pricing and the free trial.

Visual Settings

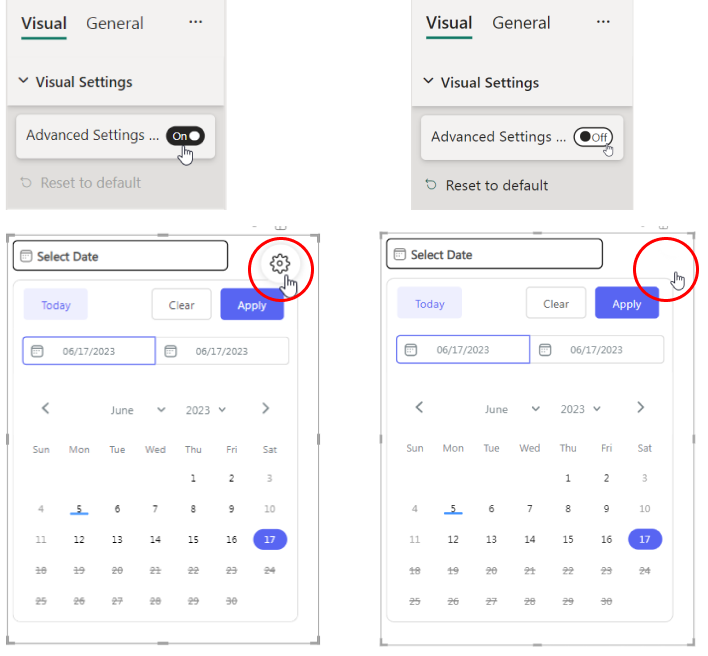
Visual settings show and hide the "Advanced Settings" icon (⚙️). This icon gives you access to open formatting options and lets you customize them. Read this article to learn more about advanced settings.

[Below are the two images showing the on-and-off situation.]
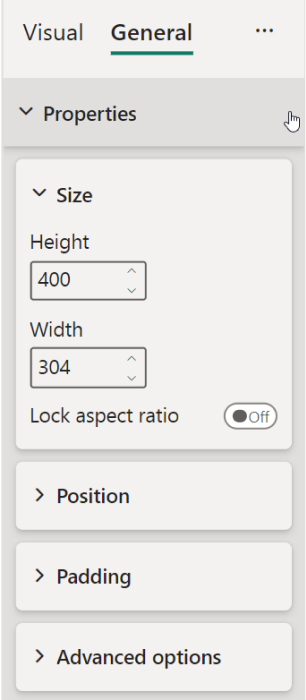
The first option in the general tab is properties. The Properties option allows you to change the size and position of the visuals. You can choose the horizontal and vertical positions on the canvas as well as the visual size's height and width. With that, control the gap and layer responsiveness using padding and advanced options.
Add a title to your visuals. The title card offers the following features:

Feature
Functionality

Title Text

Enter the custom title.

Text Formatting

Font size, color, and family.

Advanced Formatting

Bold, italic, and underline.

Background Color

Change the color.

Horizontal Alignment

Left, Right, and Center.

Text Wrap

Wrap text into multiple lines.

In the recent update, you can also add subtitles and a divider. They come with font style and color formatting options.

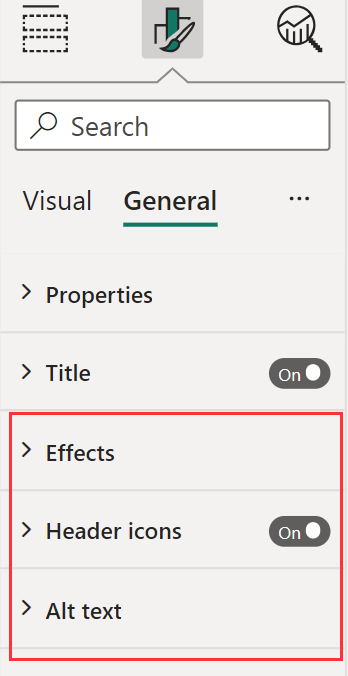
Moreover, the general settings include settings for header icons, alt text, and effects that control the background, border, and shadow. You can turn them on or off to control the selected visual option.
General Settings

General settings contain the Power BI native features that are common to all visuals. Read about them in detail .

Properties

Title

Additional Settings

​
article
​
​
​
article
​
​
​
Visual settings
Visual settings
General settings
Properties
Title
Additional settings