> For the complete documentation index, see [llms.txt](https://docs.powerviz.ai/powerviz/llms.txt). Markdown versions of documentation pages are available by appending `.md` to page URLs; this page is available as [Markdown](https://docs.powerviz.ai/powerviz/filter/introduction.md).
# Introduction
Powerviz Filter is a 100% free, advanced Power BI slicer that applies a page-level filter to the data. It provides an interactive and intuitive means of filtering data. This slicer is super easy to customize and has a user-friendly UI.
It is available for download on [AppSource](https://appsource.microsoft.com/en-us/product/power-bi-visuals/truvizinc1674781244292.filter-by-powerviz?tab=Overview) & directly from the [website](https://powerviz.ai/pricing). With Powerviz Filter, experience advanced features such as default selection, display mode, single/multiple selections, expand/collapsed node, professionally curated themes, and templates, hierarchy control themes, slicer sync mode, and full customization options, enhancing its overall functionality.
This documentation will help you get started with the Filter by explaining everything you need to know about it. If you're new to our site, check out the [visual library](https://powerviz.ai/visuals) for other visuals that meet your requirements.
**Powerviz Filter highlights include:**
1. Display Mode: Choose between `pop-up` and `canvas` views.
2. Filter selection mode: Select `single` or `multiple categories`, or `select all`.
3. Set the `default selection` from the given options, or create a custom column.
4. Keep the `selected item at the top`.
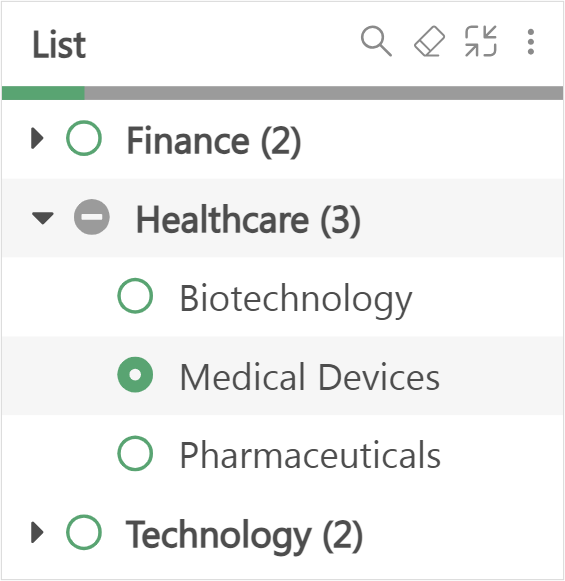
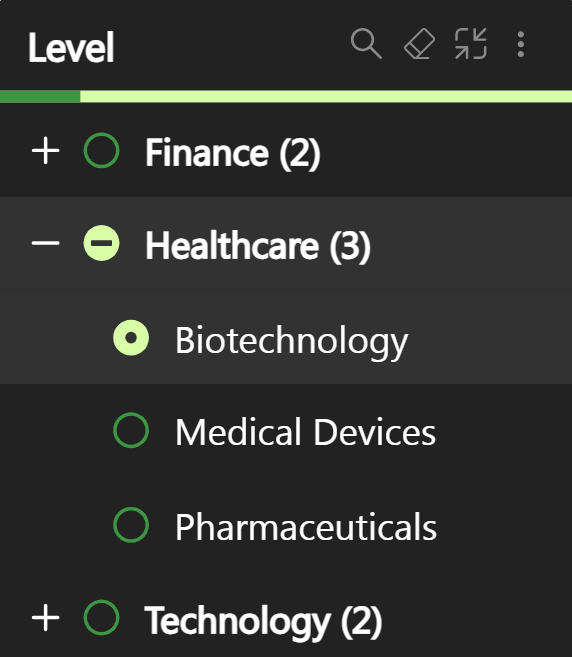
5. Control the `hierarchy` of the data, by `expand/collapse` and `by-level formatting` options.
6. Ragged Hierarchy Support: `hide blank` category and value or both just in a click and display `child as a parent`.
7. Highlight value and category using `Conditional Formatting`.
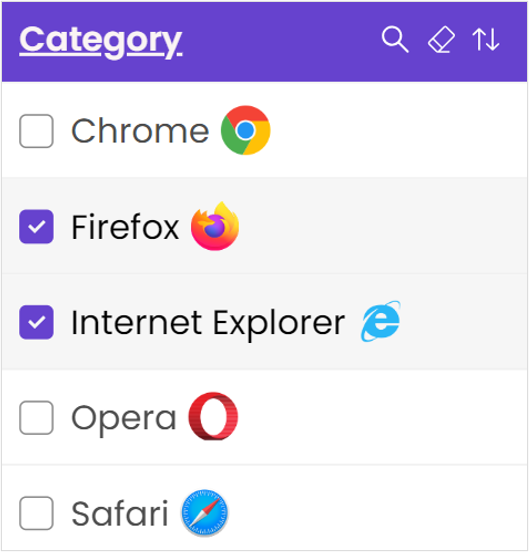
8. Add an `image` to the categories to enhance the filter.
9. Control the data by applying `filter`, `sorting`, and `ranking`.
10. `Templates` select from professionally created templates or create your own.
11. Filter Styling: `Customize` style, color, and functionality. Import or export the custom styling.
Follow this guide to have an in-depth view of the Powerviz Filter. To know more about other Powerviz visuals and slicers, visit our [`library`](https://powerviz.ai/visuals) or [`contact us`](https://powerviz.ai/contactus) directly for a demo.
### Examples