Introduction
KPI by Powerviz is a powerful custom visual for Power BI that allows users to visualize and create eye-catching and advanced Key Performance Indicators (KPIs). It contains 16 different layers and over 40 different chart variations that you can create. Using an advanced text editor, and on-object layer you can create pixel-perfect designed visuals in your next report. The best part about KPI is no prior learning is required. This add-on provided all the key features you need to create a fully dynamic KPI and sparklines.
Powerviz KPI is a Power BI custom visual available at AppSource.
This documentation will help you get started with KPI by Powerviz by explaining everything you need to know about it. If you're new to our site, check out the visual library for other visuals that met your requirements.
Table of Content
Introduction
Guides
Examples
Key features of the Powerviz KPI Visual:
Multiple Layers: KPI offers 16 layers and over 40 chart variations. Whether it’s trends, comparisons, part-to-whole, or performance metrics, KPI has you covered.
Small Multiples: Create fixed and fluid variations of KPI cards across multiple categories that allow easy comparison for quick analysis.
User-Friendly: No prior expertise needed! With an intuitive interface, you can design stunning visuals for your reports.
Text Editor: The advanced text editor lets you add Value FX, Text FX, Icon FX, and more without breaking a sweat.
Full Customization: KPI allows you to change charts, employ 30+ color palettes, and fine-tune every detail.
Advanced Capabilities: Elevate your visuals with IBCS support, variance chart type, deviation bar, highlights, and other advanced features.
On-Object Interaction: Interact seamlessly with your visual elements. KPI offers robust editing features for the customization of shapes, objects, and text with a selection pane, grouping, alignment.
Conditional Formatting: Highlight what matters most. Control icons, bars, colors, and backgrounds across the visuals dynamically based on rules without any DAX.
Templates: Create rich design in under a minute. Choose from 100+ dynamic templates and customize them according to your requirements. Click here to explore predesigned templates for KPI by Powerviz.
Follow this guide to have an in-depth view of our KPI. To know more about other Powerviz visuals and slicers, visit our library or contact us directly for a demo.
Examples

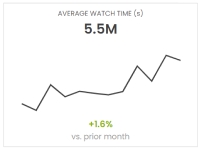
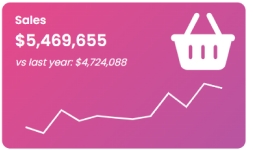
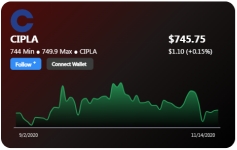


Last updated