
Format Pane
This section consists of all the settings and formatting options that fall under the Format tab offered by the Powerviz. It includes settings for number formatting, title, background, and others. If you want to know about advanced settings, read this article.
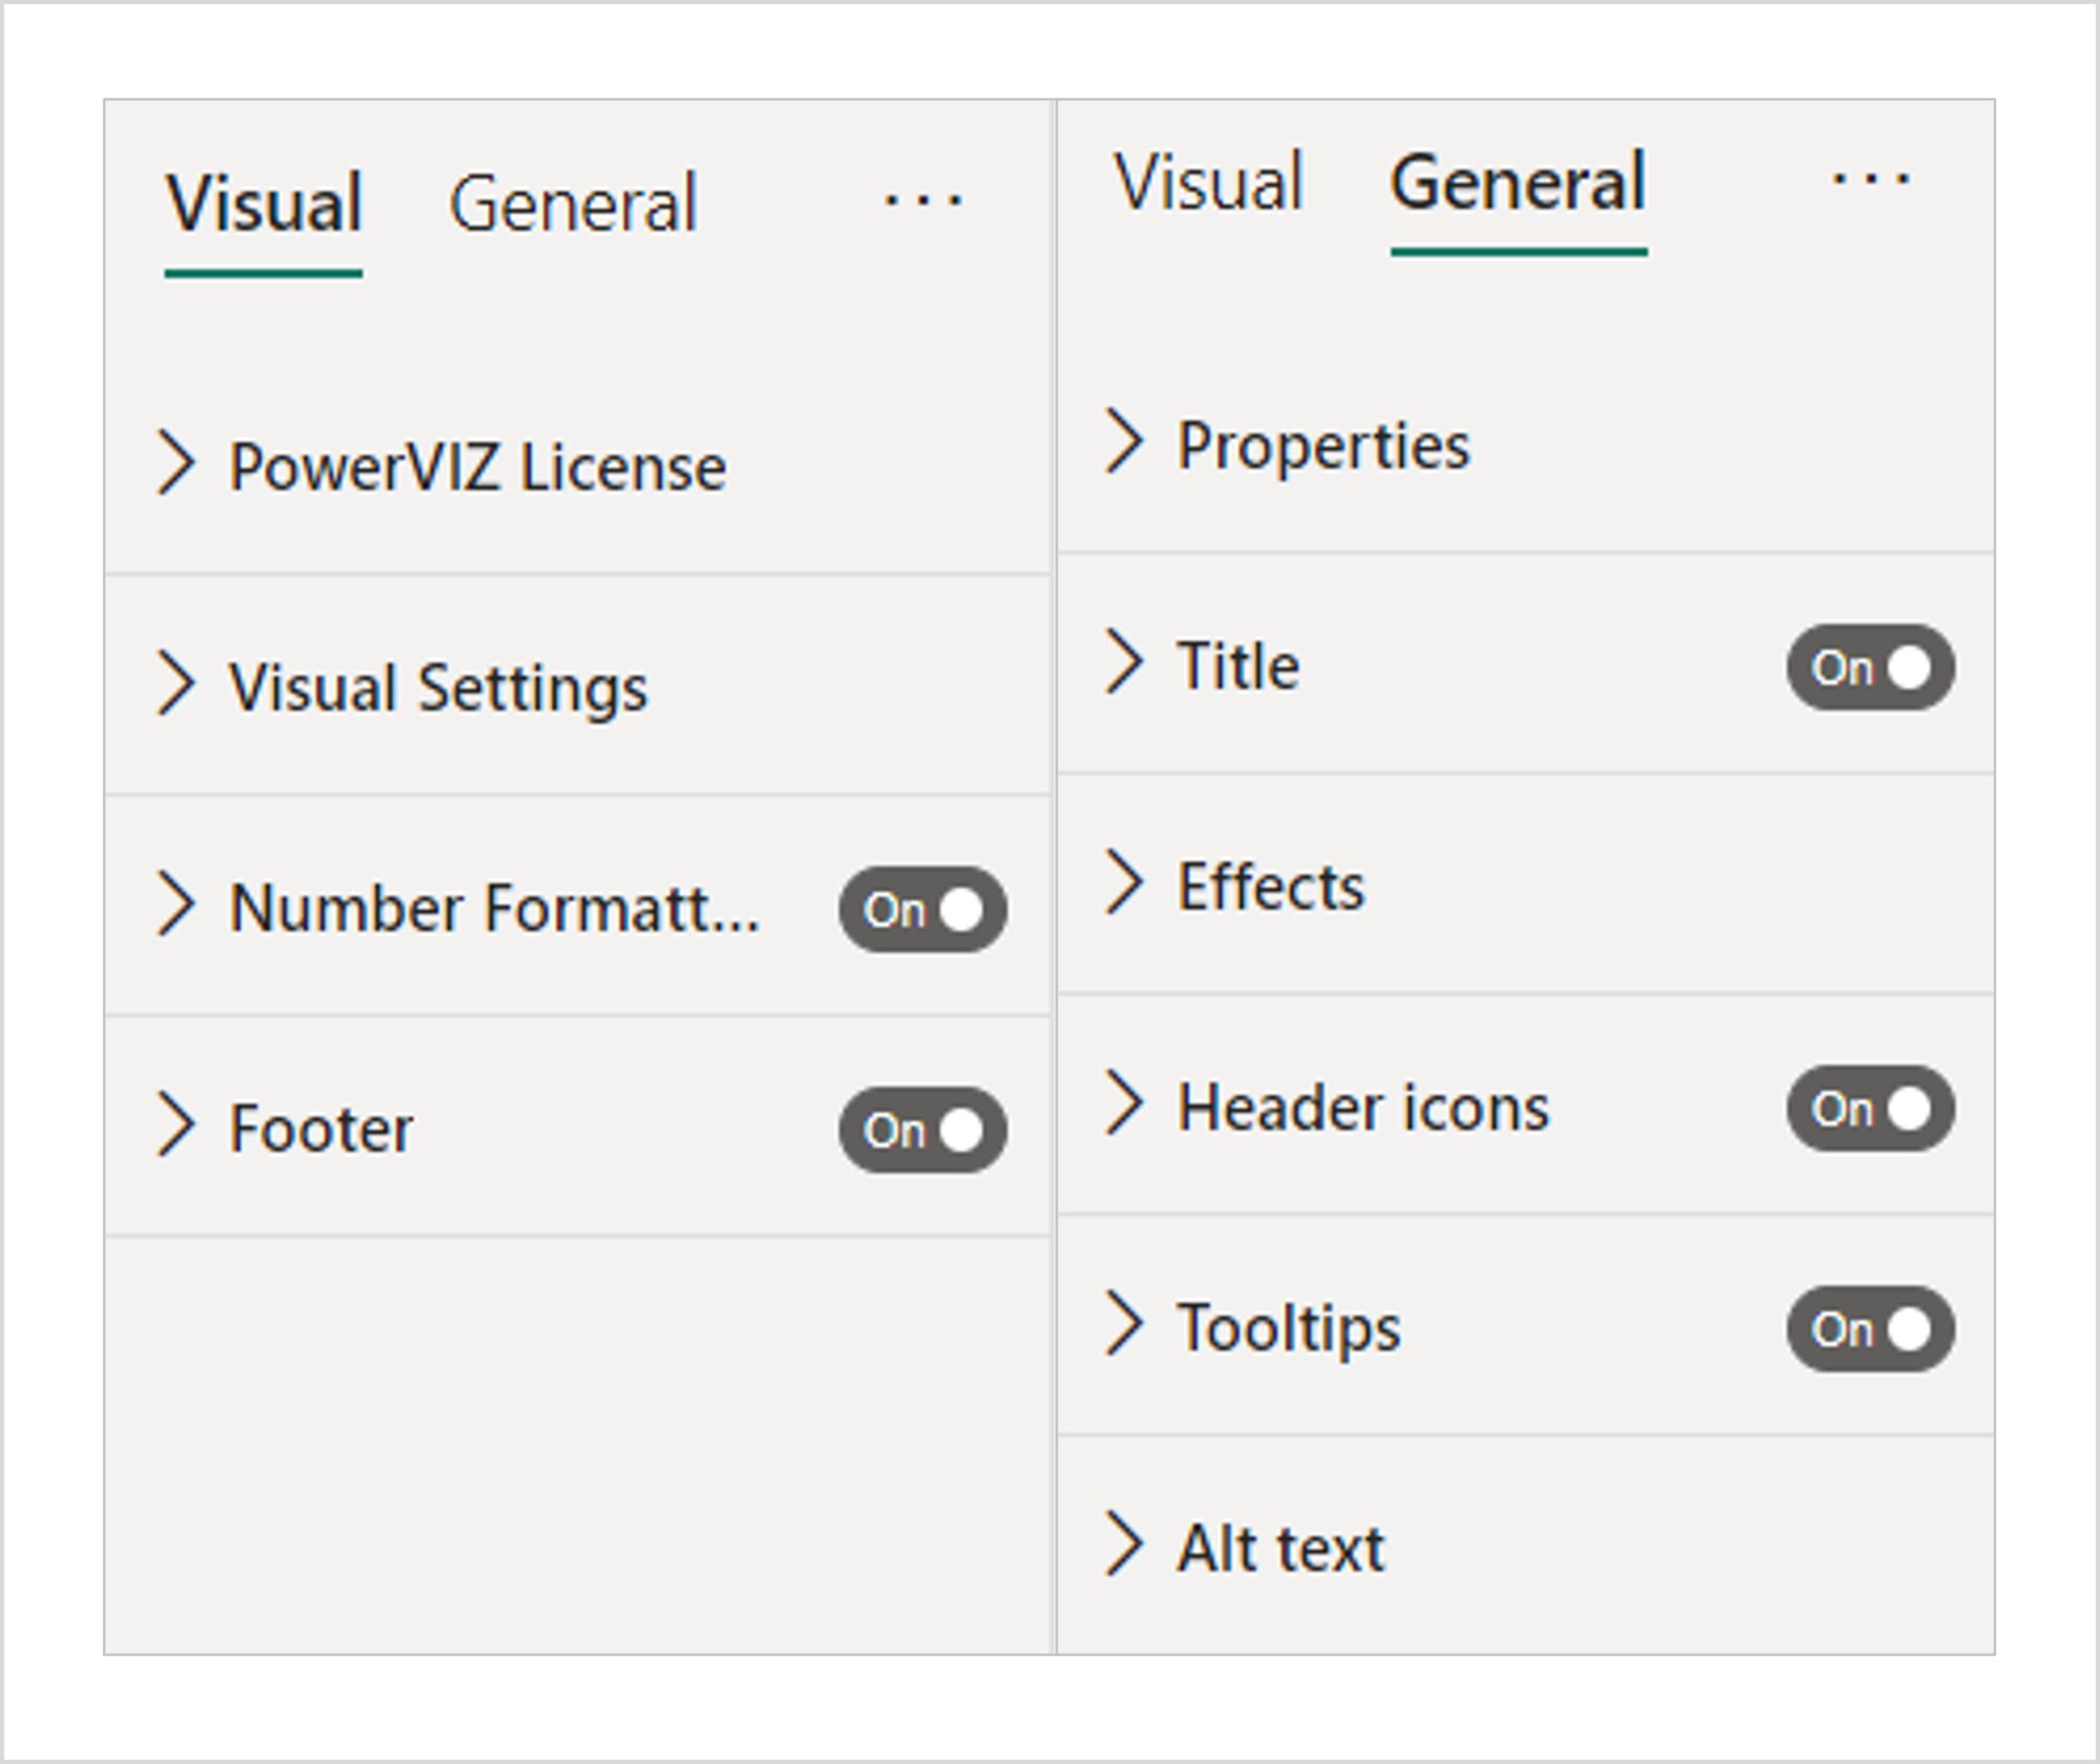
Format visual is divided into 2 sections – Visual and General
Visual Section Includes
Powerviz License
Visual Settings
Number formatting
Footer
General Section Includes
Properties
Title
Additional Settings
Visual Sections
Powerviz License
Once you've joined Powerviz, you'll have access to all the visuals in the library. You have received your credentials, which you must enter here to use the pro version.
Click here for more information about pricing and the free trial.
Visual Settings
This option lets you control the advanced setting, grid view , and lasso/reverse lasso effects.
By turning on/off the toggle bar you can choose to show or hide all these options on the visual.
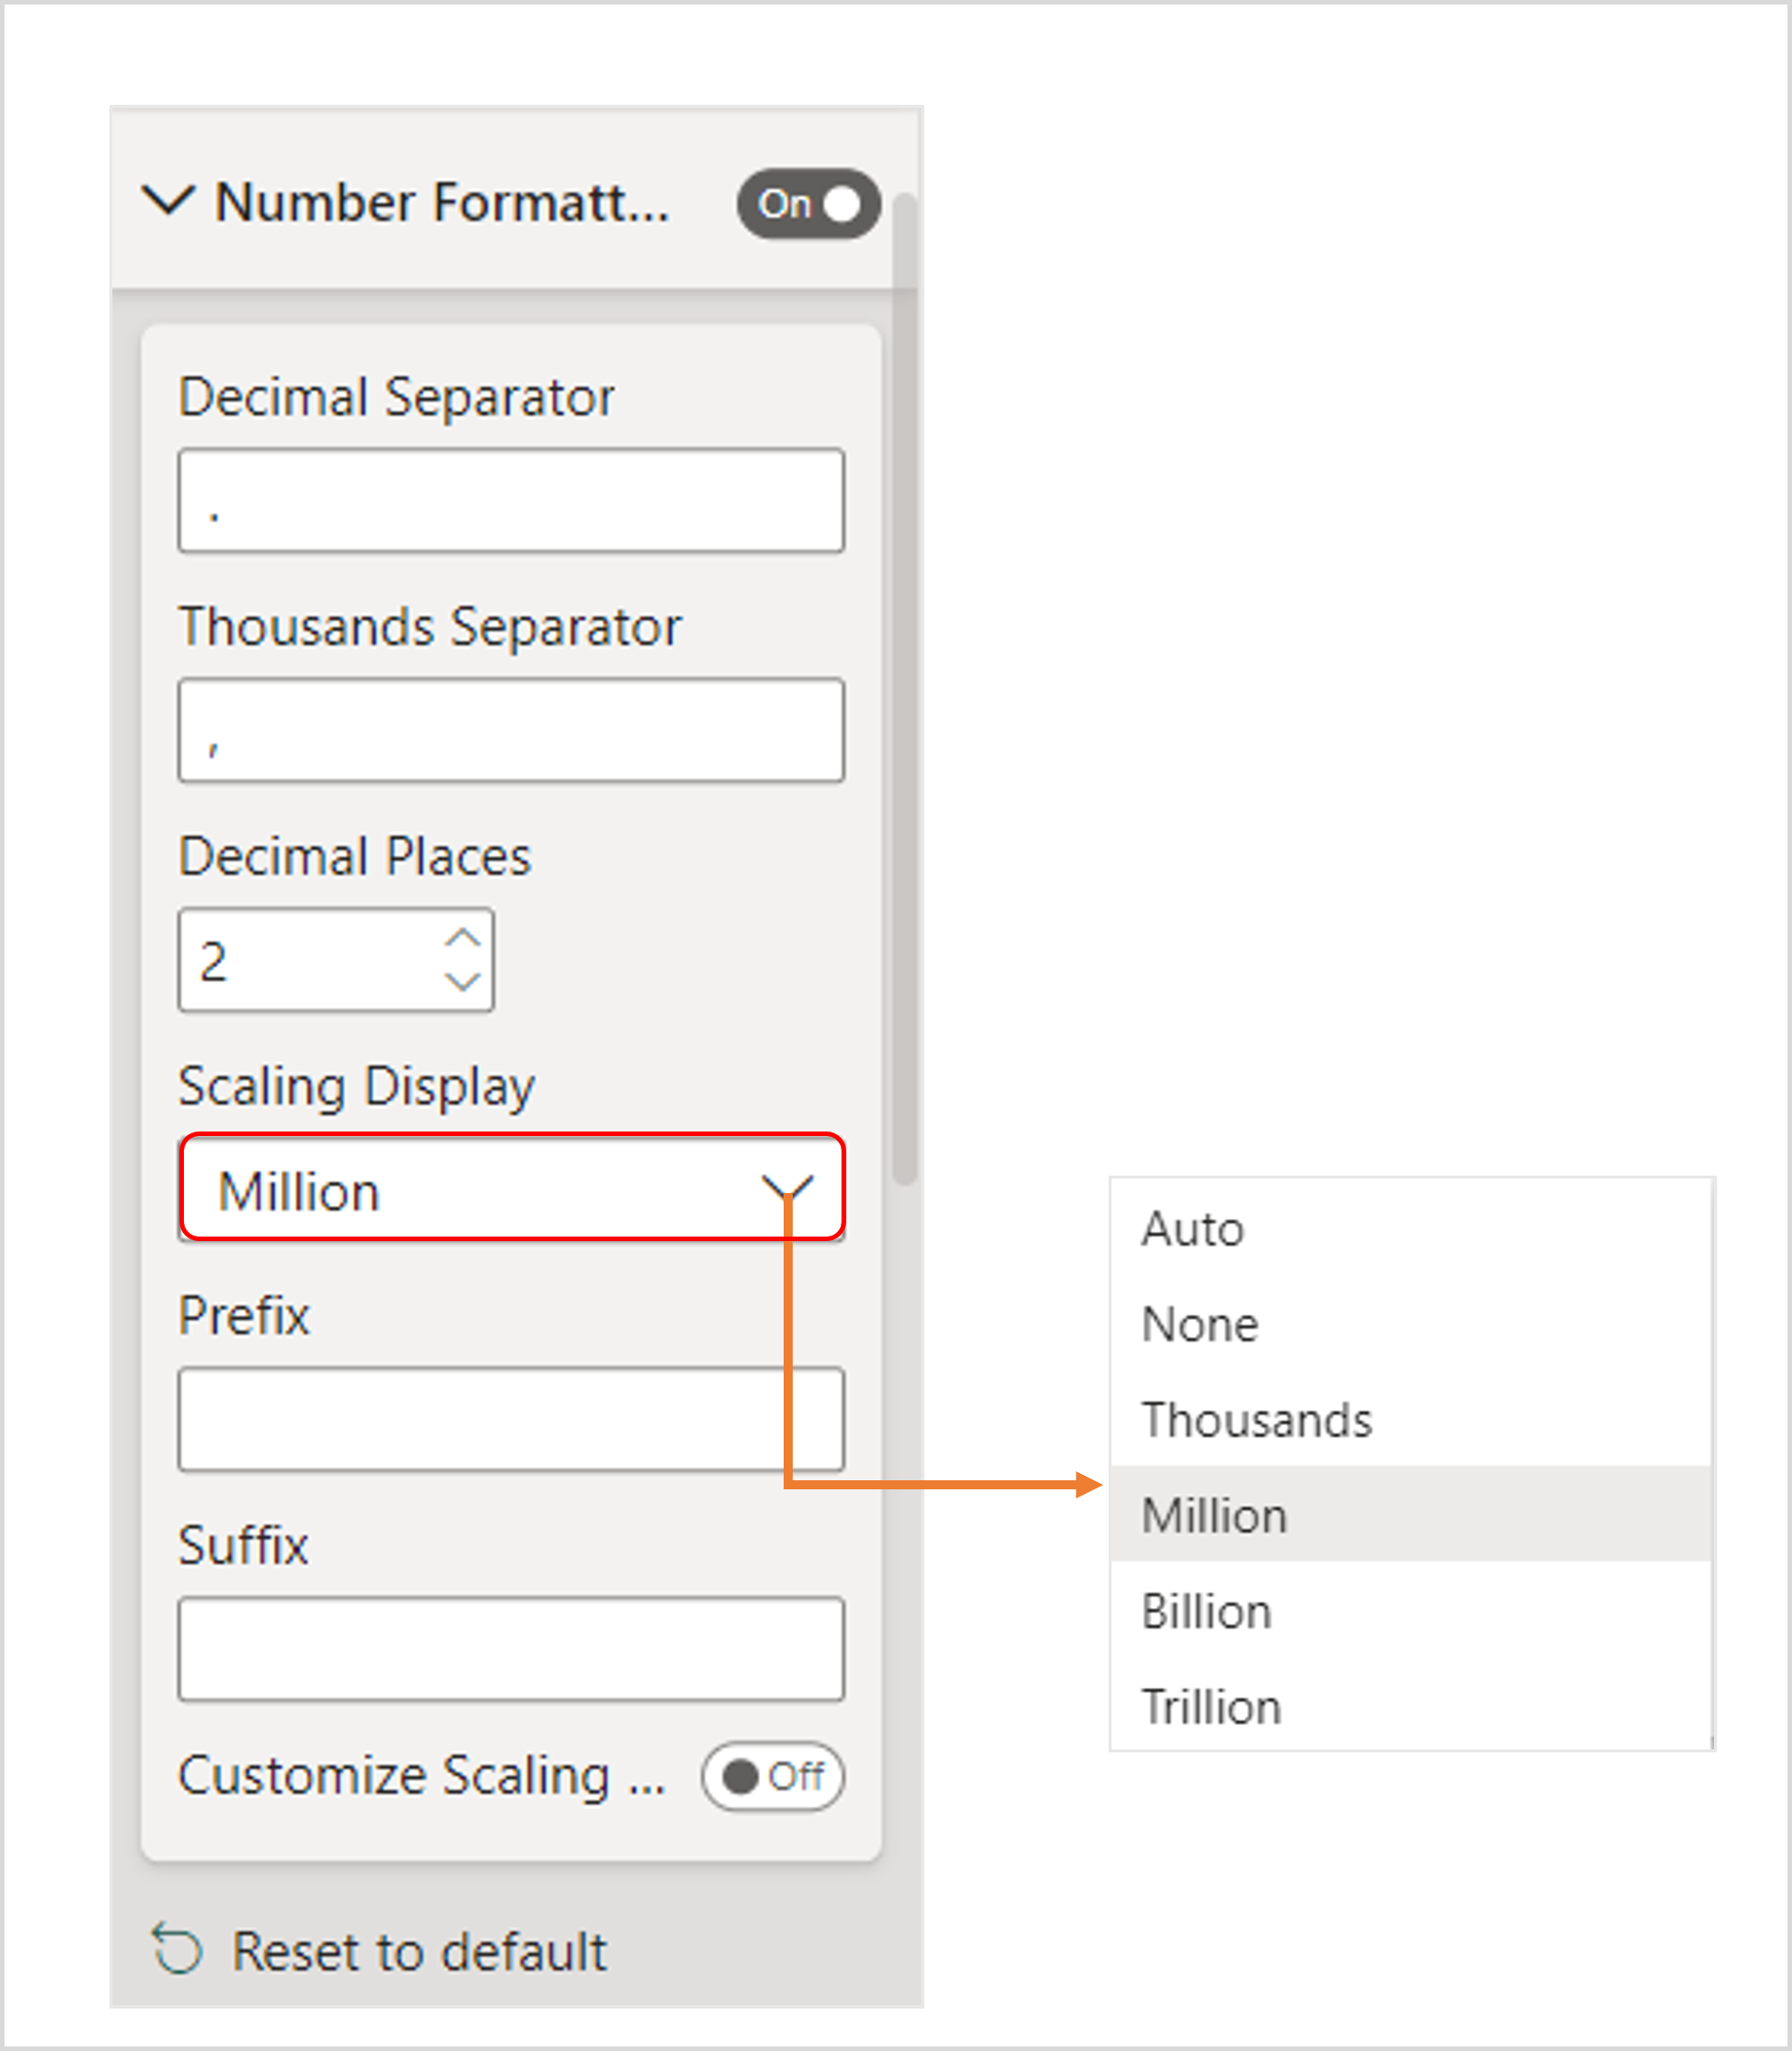
Number Formatting
Use number formatting to format the metric value. This number format allows easy formatting.
The number formatting provides the following option:
Decimal Separator
The decimal separator by default is **. (1.23). It can be changed to any other symbol.
Thousand Separator
The thousand separator by default is , (1,000). It can be changed to any other symbol.
Decimal Places
Choose the number of decimal places.
Scaling Display
Control the scale of value from the list of auto, none, thousands, million, billion, and trillion.
Prefix
The prefix comes before the value and can be customized.
Suffix
Suffixes come after the value and can be customized.
Customized Scaling Label
To modify the scaling format, use the “customized scaling label”. The word "million," for instance, can be spelled as "millions, M, or Mn.
Footer
In Powerviz Word Cloud visual, you can also add a footer at the bottom of the chart for additional context.
Enable Footer > Input Text field.
You can also add the URL in Web URL Box.
Show/hide the border by controlling its width and color.
Define the footer’s font size, color, and family.
Determine the footer background.
Choose footer alignment - left, center, and right.

General Sections
General settings contain the Power BI native features that are common in all visual. Read about them in detail here.
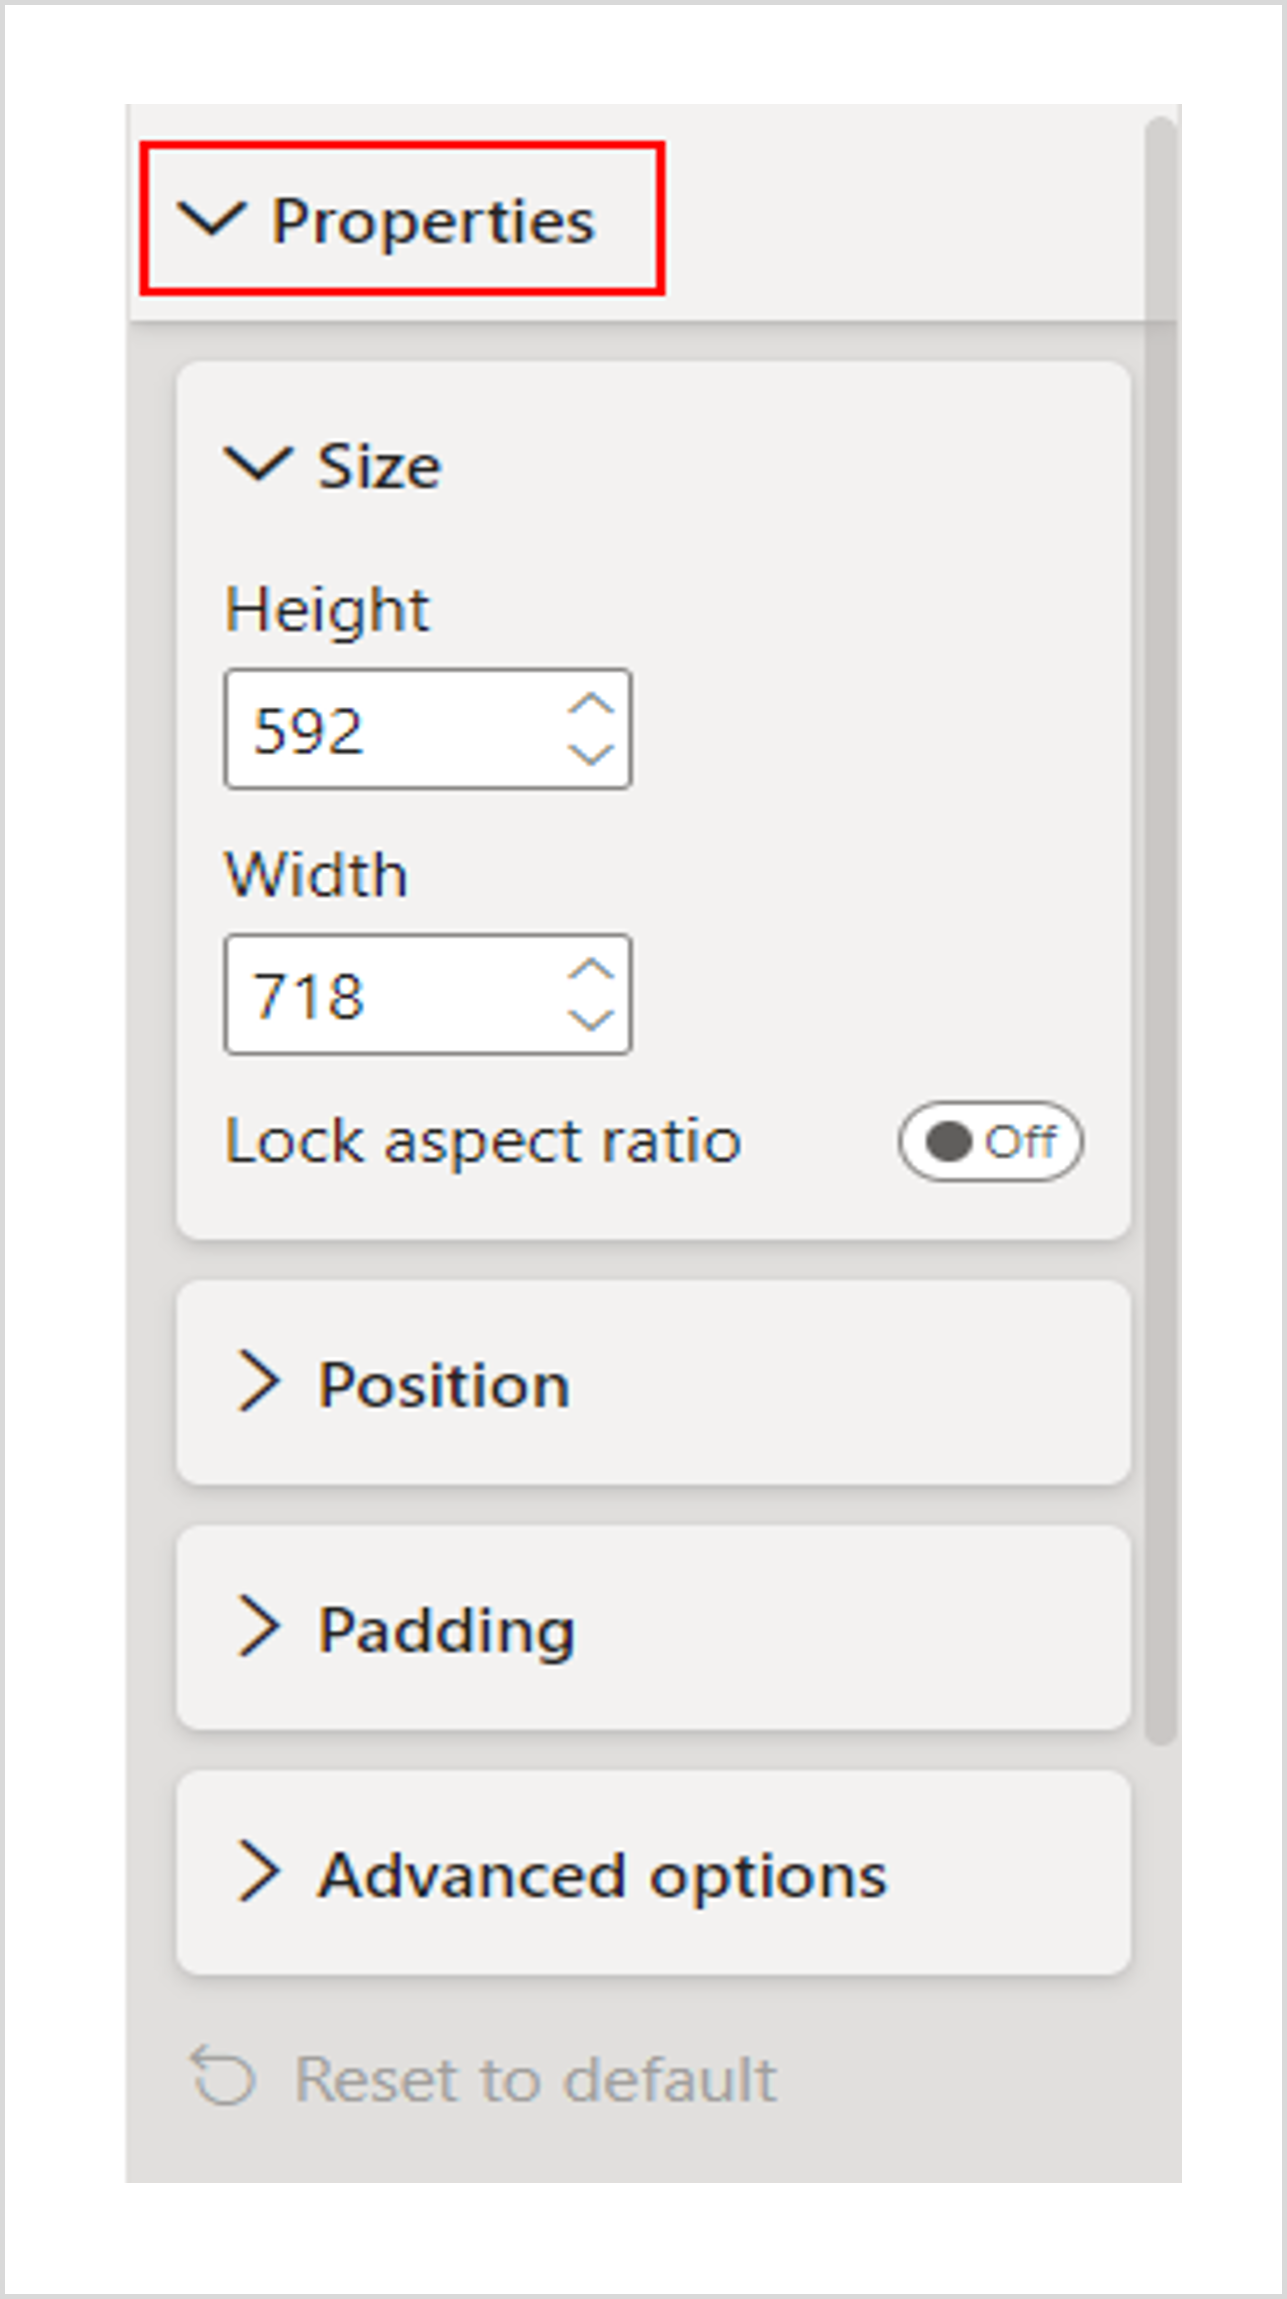
Properties
In the General tab, this is the first option. The properties option allows us to change the size, position, and padding of the visuals. You can customize the visual size's height and width, and position’s horizontal and vertical.
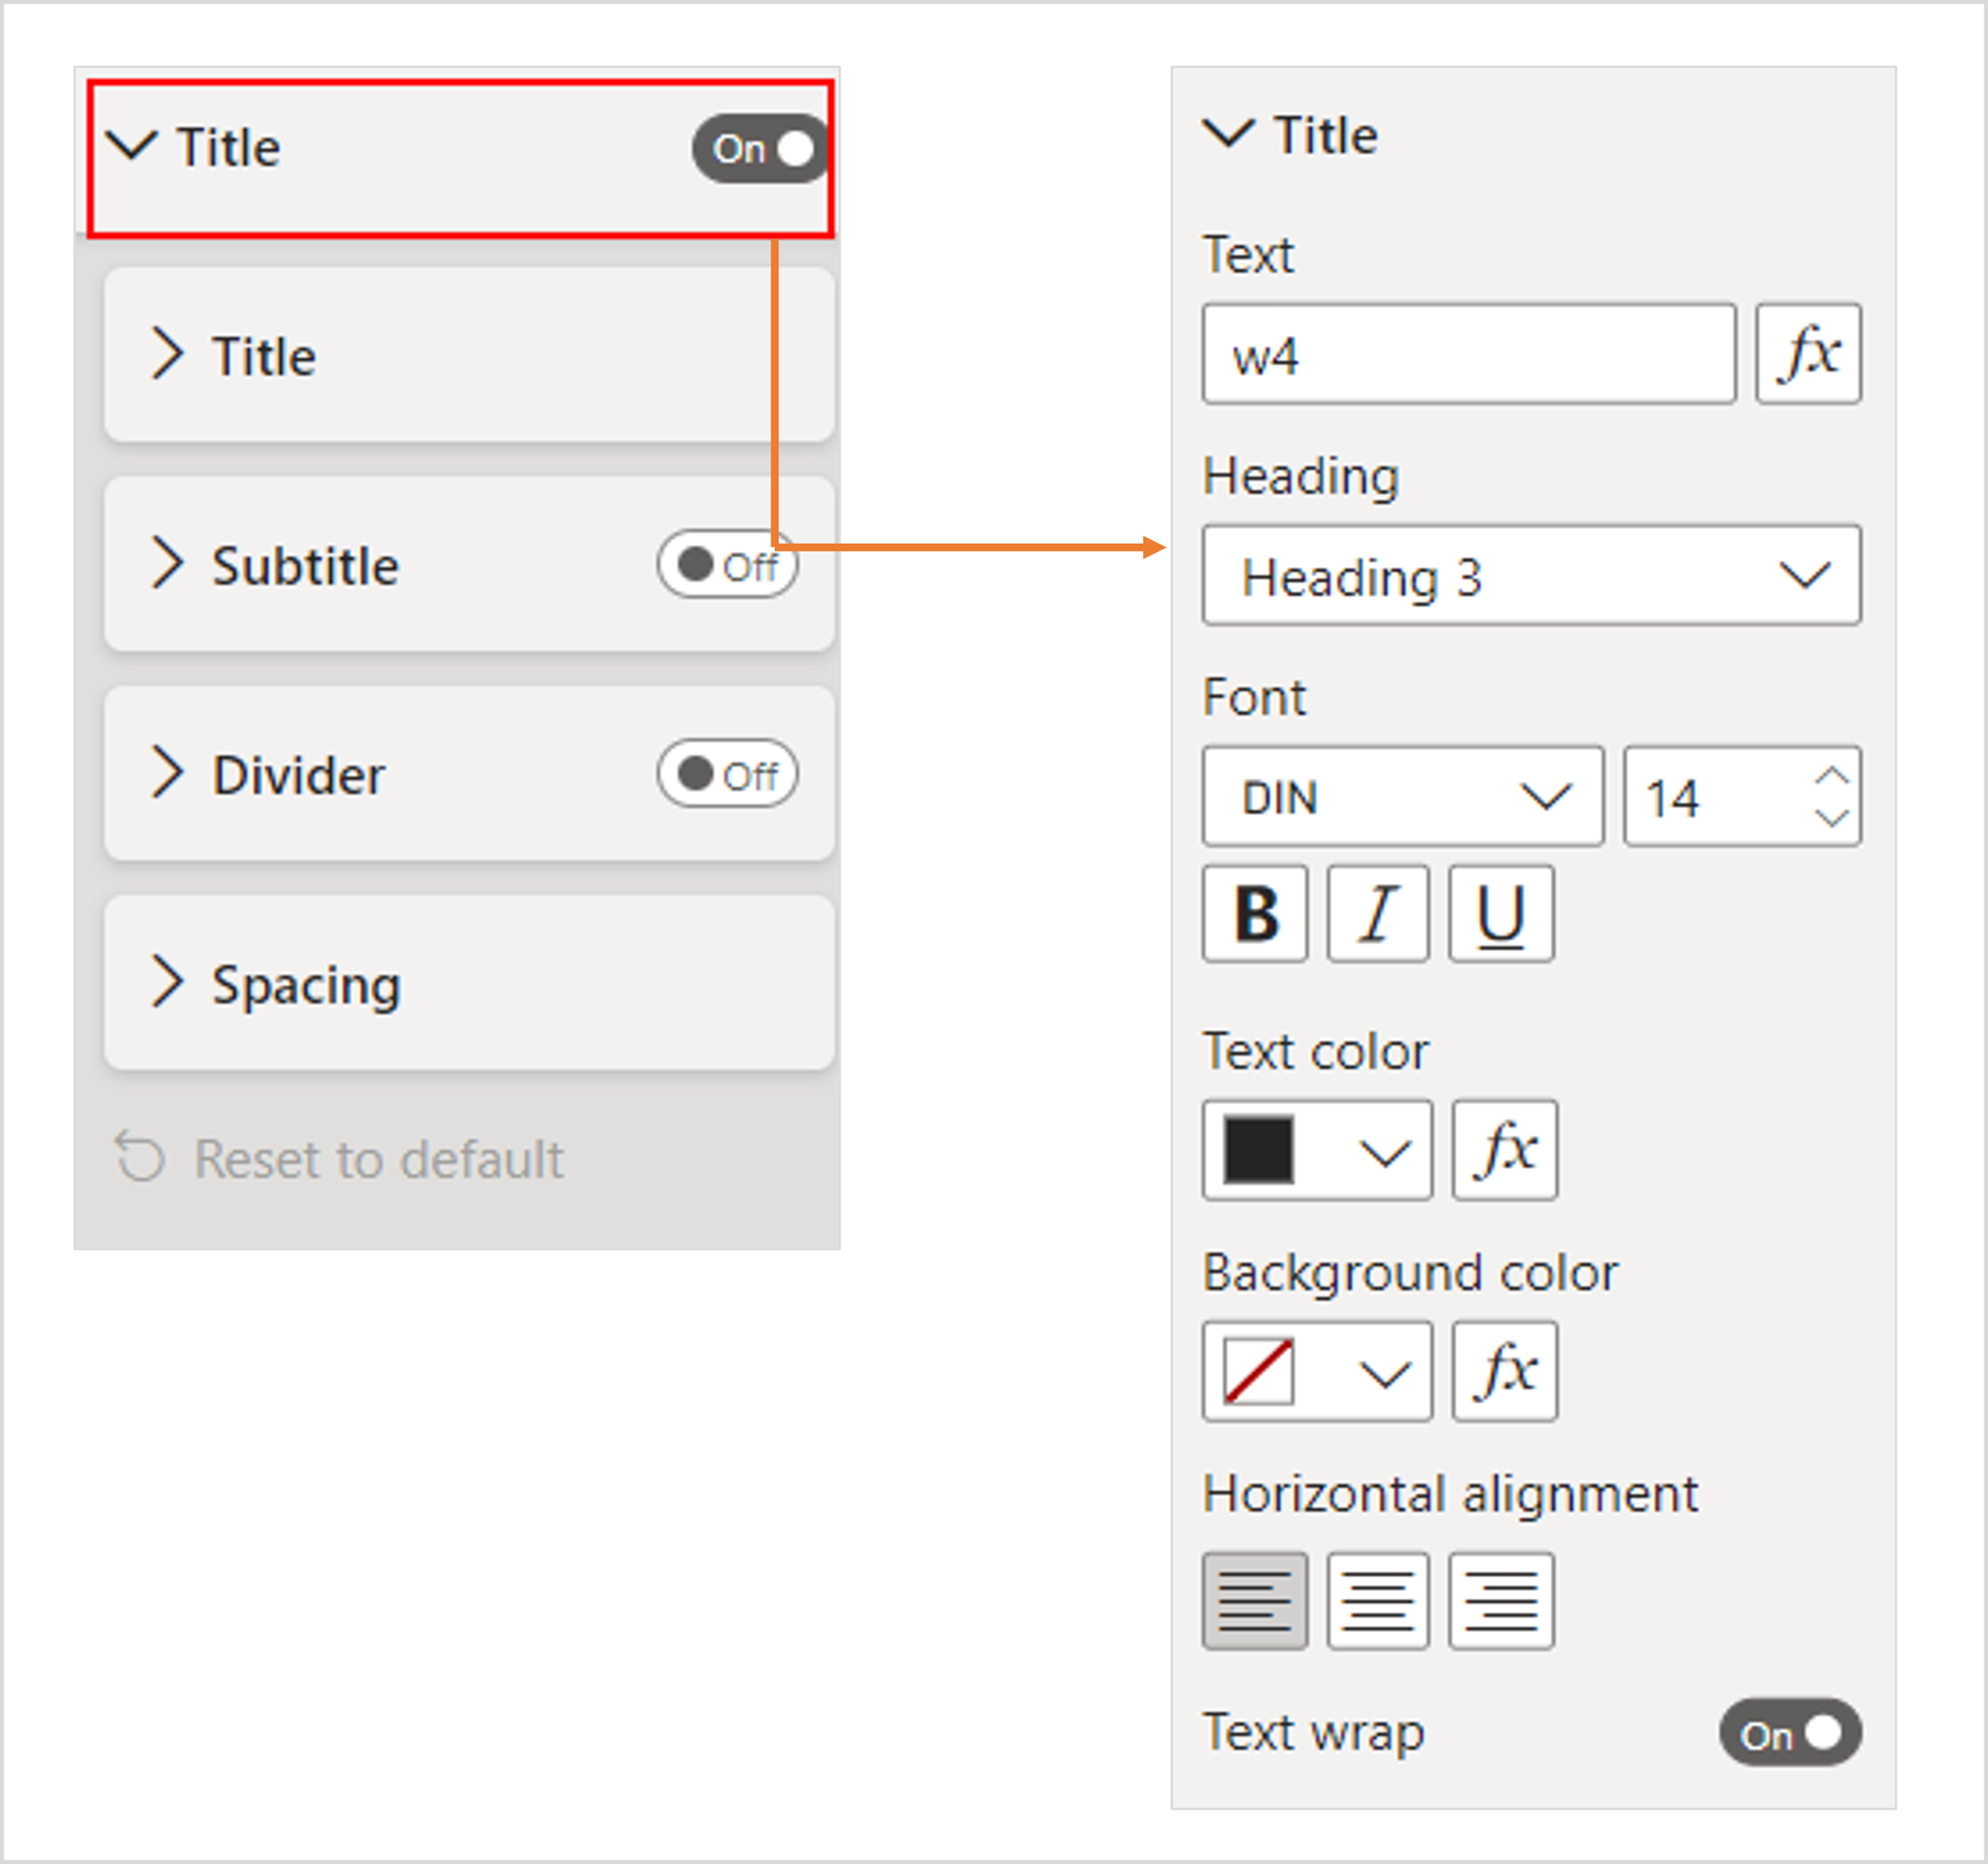
Title
Add a title to your visuals. The title card offers the following features.
Title Text
Enter the custom title.
Text Formatting
Font size, color, and family.
Advanced Formatting
Bold, italic, and underline.
Background Color
Change the color.
Horizontal Alignment
Left, right, and center.
Text Wrap
Wrap text into multiple lines.
In the recent update, you could also add subtitles and a divider. They come with font style and color formatting options.
Additional Settings
Moreover, the general settings include settings for tooltips, header icons, alt text, and effects that control the background, border, and shadow. You can turn them on or off to control the selected visual option.

Last updated