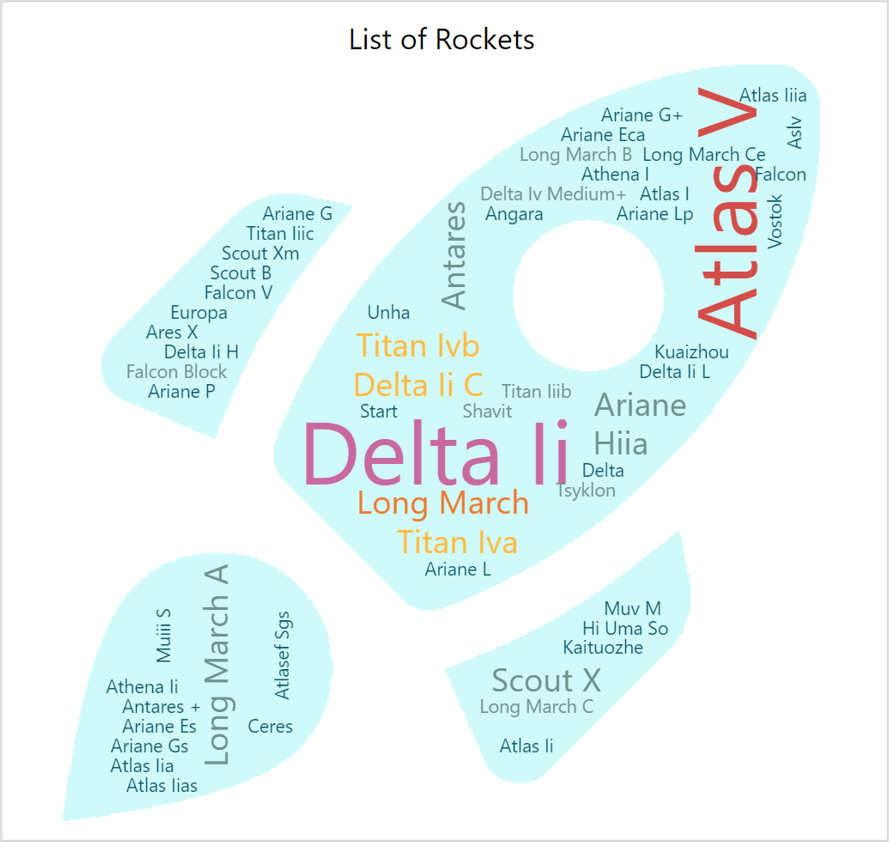
Powerviz
  • Introduction
  • Installation Guide
    • Install from Appsource
    • Import through file
    • Adding the Powerviz visuals as Organization visuals
  • Date Picker
    • Introduction
    • Get Started
    • Format Pane
    • Advanced Settings: Introduction
      • Calendar
      • Formatting
      • Date Picker Button
      • Default Selection
      • Date Selector
      • Presets
      • Selection Controls
      • Date Range
      • Invalid Dates
      • Weekends/Holidays
    • Themes
      • Default Theme
      • Custom Theme
  • Sunburst
    • Introduction
    • Get Started
    • Format Pane
    • Advanced Settings: Introduction
      • Chart Options
      • Data Colors
      • Fill Patterns
      • Arc Settings
      • Labels
      • Sorting
      • Ranking
      • Center Circle
      • Leaf Label Images
      • Conditional Formatting
      • Show Condition
      • Annotations
      • Grid View
    • FAQ
  • KPI
    • Introduction
    • Get Started
    • Format Pane
    • Edit Mode - Introduction
      • KPI Charts
        • Advanced Text
        • Bar Chart
        • Lollipop Chart
        • Line Chart
        • Area Chart
        • Combo Chart
        • Donut Chart
        • Pie Chart
        • Linear Gauge
        • Liquid Gauge
        • Radial Gauge
        • Bullet Chart
        • Waterfall Chart
        • Icon
        • Image
        • Shape
      • Templates
      • Small Multiples
      • Actions
      • Import/Export
  • Activity Gauge
    • Introduction
    • Get Started
    • Format Pane
    • Advance settings: Introduction
      • Gauge Options
      • Target
      • Data Colors
      • Fill Patterns
      • Labels
      • Ranking
      • Sorting
      • Center Circle
      • Mouse Over Text
      • Conditional Formatting
      • Show Condition
      • Grid View
      • Annotations
  • Funnel Chart
    • Introduction
  • Horizon Chart
    • Introduction
  • Ridgeline Plot
    • Introduction
  • Rose/ Donut/Pie Chart
    • Introduction
  • Word Cloud
    • Introduction
    • Get Started
    • Format Pane
    • Advanced Settings: Introduction
      • Word Options
      • Data Colors
      • Shapes
      • Text Style
      • Direction
      • Ranking
      • Exclude
      • Conditional Formatting
      • Show Condition
      • Grid View
      • Lasso and Reverse Lasso
  • Linear Gauge
    • Introduction
  • Filter
    • Introduction
    • Get Started
    • Format Pane
    • Advanced Settings - Introduction
      • Filter Settings
      • Cell Style
      • Cell Colors
      • Title Bar
      • Column Headers
      • Image Styling
      • Default Selection
      • Conditional Formatting
      • Import/Export
      • Templates
  • Lollipop Chart
    • Introduction
  • Heatmap
    • Introduction
    • Get Started
    • Format Pane
    • Advanced Settings: Introduction
      • Shapes
      • Data Colors
      • Data Labels
      • Axis Settings
      • Grid Lines
      • Sorting
      • Plot Area
      • Reference Lines
      • Ranking
      • Totals
      • Small Multiples
      • Conditional Formatting
      • Show Condition
      • Grid view
      • Lasso and Reverse Lasso
  • Network Graph
    • Introduction
  • Sankey Chart
    • Introduction
Powered by GitBook
On this page
  1. Word Cloud

Introduction

PreviousIntroductionNextGet Started

Last updated 10 months ago

Powerviz is a visual type used to represent text-based data. The term word cloud is also known as text cloud and tag cloud. This is commonly used to highlight the frequency of words within a given category. This provides a quick and comprehensive glimpse into a big volume of text.

Powerviz Word Cloud is a Power BI custom visual available at

Powerviz Word Cloud is beneficial in a variety of situations, including text-rich data, content analysis, open-ended surveys, research, and interviews.

This documentation will help you get started with Word Cloud visual by explaining everything you need to know about it. If you're new to our site, check out the for other visuals that met your requirements.

Table of Content

  1. Introduction

  2. Guides

  3. Examples

Key features of the Powerviz Word Cloud Visual:

  • Customize font style, size, and color.

  • Choose from over 2000 icons, images, or uploads from a local computer/URL.

  • Select colors from 6 schemes and 30+ palettes.

  • Use the ranking feature to prioritize significant words in the dataset.

  • Manage phrases by splitting into meaningful words.

  • Filter and modify text by excluding unwanted characters, numbers, punctuations, emojis, and conjunctions.

  • Choose the text orientation from 8 different options.

  • Add multiple conditional formatting rules to color words based on predefined logic.

  • Additional features include grid view, lasso, and reverse lasso.

Follow this guide to have an in-depth view of our Word Cloud visual. To know more about other Powerviz visuals and slicers, visit our or directly for a demo.

Examples

Word Cloud
AppSource.
visual library
library
contact us
​