Powerviz
  • Introduction
  • Installation Guide
    • Install from Appsource
    • Import through file
    • Adding the Powerviz visuals as Organization visuals
  • Date Picker
    • Introduction
    • Get Started
    • Format Pane
    • Advanced Settings: Introduction
      • Calendar
      • Formatting
      • Date Picker Button
      • Default Selection
      • Date Selector
      • Presets
      • Selection Controls
      • Date Range
      • Invalid Dates
      • Weekends/Holidays
    • Themes
      • Default Theme
      • Custom Theme
  • Sunburst
    • Introduction
    • Get Started
    • Format Pane
    • Advanced Settings: Introduction
      • Chart Options
      • Data Colors
      • Fill Patterns
      • Arc Settings
      • Labels
      • Sorting
      • Ranking
      • Center Circle
      • Leaf Label Images
      • Conditional Formatting
      • Show Condition
      • Annotations
      • Grid View
    • FAQ
  • KPI
    • Introduction
    • Get Started
    • Format Pane
    • Edit Mode - Introduction
      • KPI Charts
        • Advanced Text
        • Bar Chart
        • Lollipop Chart
        • Line Chart
        • Area Chart
        • Combo Chart
        • Donut Chart
        • Pie Chart
        • Linear Gauge
        • Liquid Gauge
        • Radial Gauge
        • Bullet Chart
        • Waterfall Chart
        • Icon
        • Image
        • Shape
      • Templates
      • Small Multiples
      • Actions
      • Import/Export
  • Activity Gauge
    • Introduction
    • Get Started
    • Format Pane
    • Advance settings: Introduction
      • Gauge Options
      • Target
      • Data Colors
      • Fill Patterns
      • Labels
      • Ranking
      • Sorting
      • Center Circle
      • Mouse Over Text
      • Conditional Formatting
      • Show Condition
      • Grid View
      • Annotations
  • Funnel Chart
    • Introduction
  • Horizon Chart
    • Introduction
  • Ridgeline Plot
    • Introduction
  • Rose/ Donut/Pie Chart
    • Introduction
  • Word Cloud
    • Introduction
    • Get Started
    • Format Pane
    • Advanced Settings: Introduction
      • Word Options
      • Data Colors
      • Shapes
      • Text Style
      • Direction
      • Ranking
      • Exclude
      • Conditional Formatting
      • Show Condition
      • Grid View
      • Lasso and Reverse Lasso
  • Linear Gauge
    • Introduction
  • Filter
    • Introduction
    • Get Started
    • Format Pane
    • Advanced Settings - Introduction
      • Filter Settings
      • Cell Style
      • Cell Colors
      • Title Bar
      • Column Headers
      • Image Styling
      • Default Selection
      • Conditional Formatting
      • Import/Export
      • Templates
  • Lollipop Chart
    • Introduction
  • Heatmap
    • Introduction
    • Get Started
    • Format Pane
    • Advanced Settings: Introduction
      • Shapes
      • Data Colors
      • Data Labels
      • Axis Settings
      • Grid Lines
      • Sorting
      • Plot Area
      • Reference Lines
      • Ranking
      • Totals
      • Small Multiples
      • Conditional Formatting
      • Show Condition
      • Grid view
      • Lasso and Reverse Lasso
  • Network Graph
    • Introduction
  • Sankey Chart
    • Introduction
Powered by GitBook
On this page
  • Anatomy​
  • Add an annotation on the arc​
  • Preview​
  • Tutorial​
  1. Activity Gauge
  2. Advance settings: Introduction

Annotations

PreviousGrid ViewNextIntroduction

Last updated 9 months ago

nnotations allow you to add a comment on a specific node. By default, the node is collapsed, and you must hover over the icon to see the comment. In Powerviz annotations, you’ll get multiple options to add a comment. Input types include text, links, images, and dynamic measures. Along with that, you can format each type by color, size, and effect.

Anatomy​

It contains

  • Font styling : It controls options like text family, color, size, effect, and alignment. Along with this text, it can be converted into bullet points.

  • Insert media : In annotations, the user can place images, links, and measure in the comment box. The measure is dynamic.

  • Background fill : Use this to change the canvas background color.

  • Connector styling : This contains all the color and style formatting for the connector line.

  • Badge styling : This controls the color and display of the badge.

  • Apply button : Use the apply button to save the changes.

Add an annotation on the arc​

  1. Hover over the visual and select the chat icon from the top right corner.

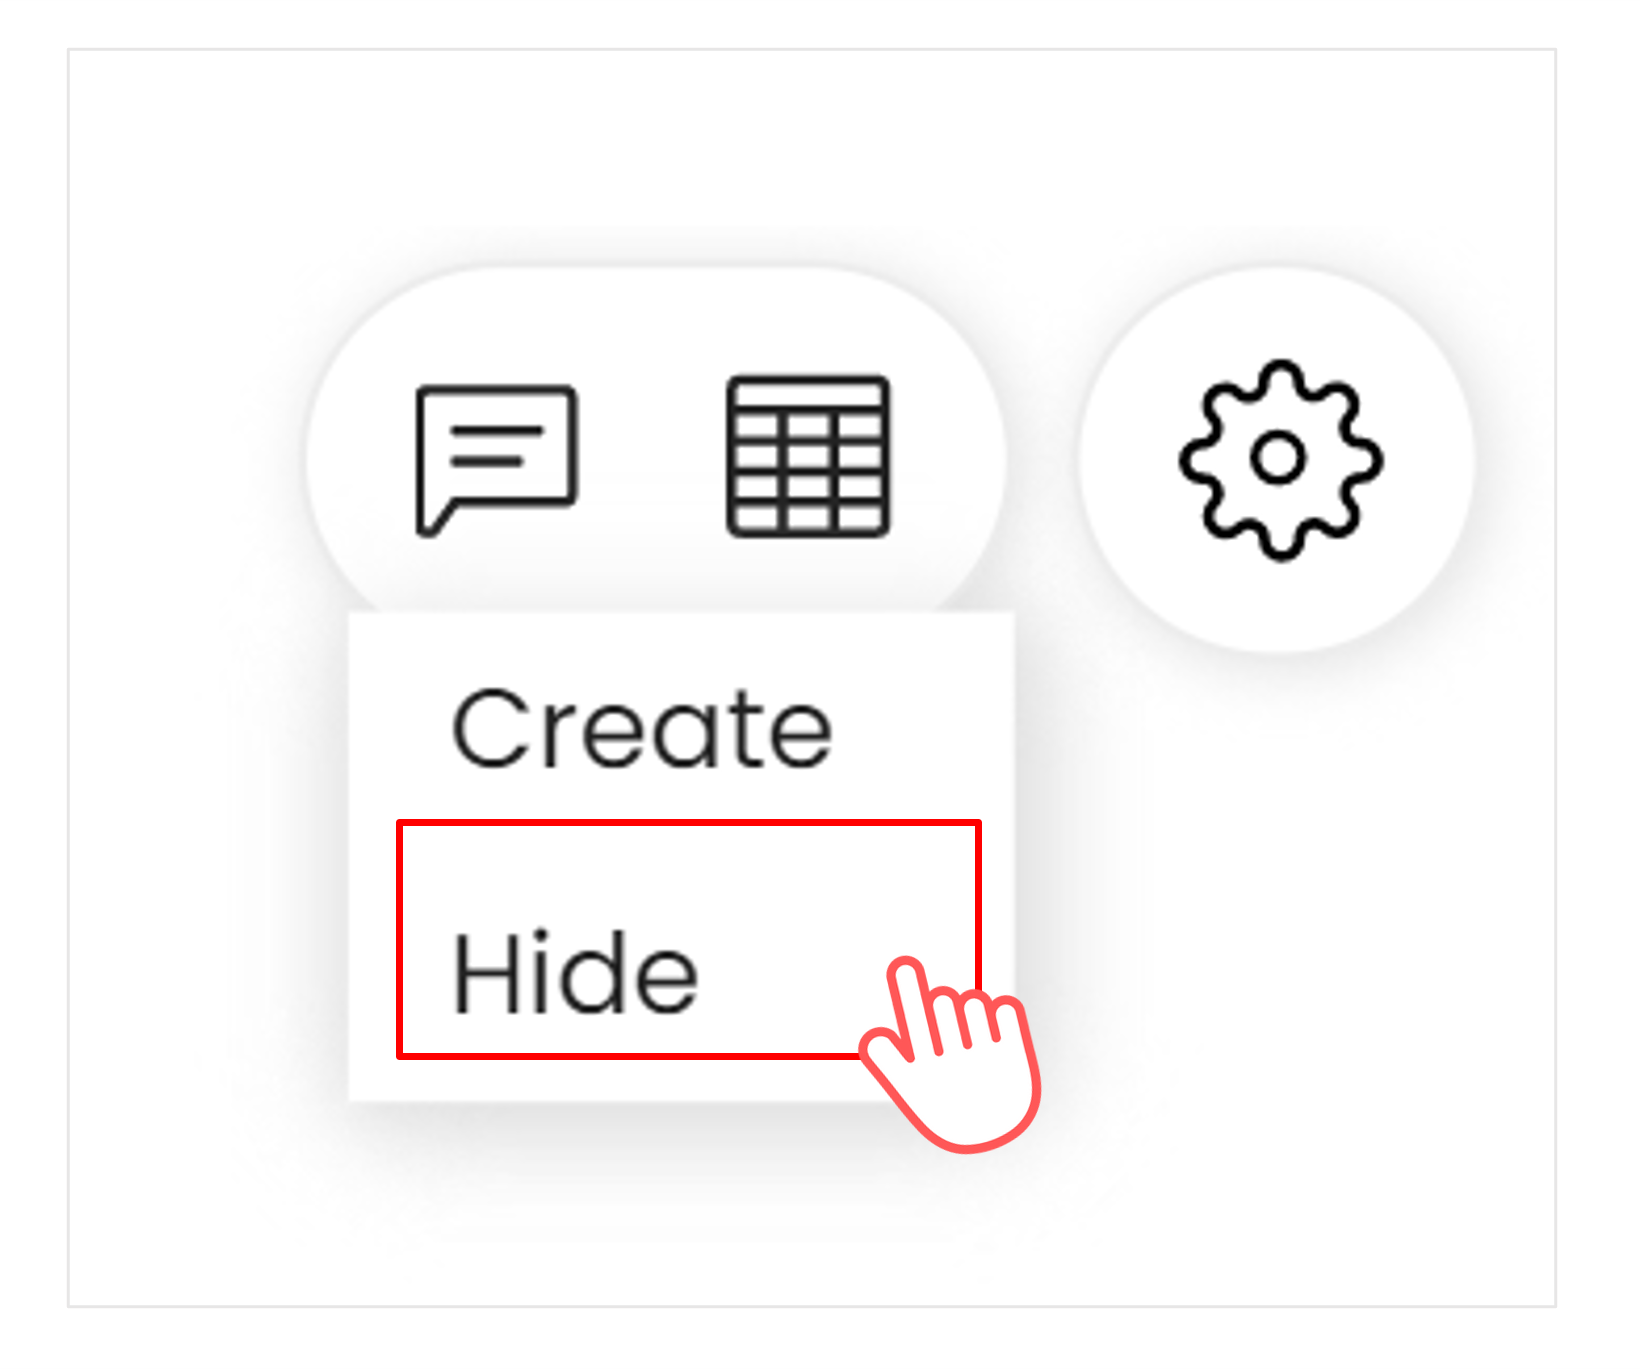
  2. Annotation has two options: create and hide.

    Create lets you add comments, whereas Hide lets you hide all the annotations for that session.
  1. Click on Create. The cursor will act as a selector.

  2. Now carefully select the arc where you want to place the annotation.

  3. Once clicked, the annotation editor pop-up will open.

  4. Input the message, image, link, and measure. Change the formatting as required.

  5. Hit Apply to save.

Preview​

Tutorial​

Watch out for three on-hover annotation options: resize, reposition, and rotate.

ATTENTION

Any modifications made in reading mode will not be saved and will return to the default state upon page refresh.