Powerviz
  • Introduction
  • Installation Guide
    • Install from Appsource
    • Import through file
    • Adding the Powerviz visuals as Organization visuals
  • Date Picker
    • Introduction
    • Get Started
    • Format Pane
    • Advanced Settings: Introduction
      • Calendar
      • Formatting
      • Date Picker Button
      • Default Selection
      • Date Selector
      • Presets
      • Selection Controls
      • Date Range
      • Invalid Dates
      • Weekends/Holidays
    • Themes
      • Default Theme
      • Custom Theme
  • Sunburst
    • Introduction
    • Get Started
    • Format Pane
    • Advanced Settings: Introduction
      • Chart Options
      • Data Colors
      • Fill Patterns
      • Arc Settings
      • Labels
      • Sorting
      • Ranking
      • Center Circle
      • Leaf Label Images
      • Conditional Formatting
      • Show Condition
      • Annotations
      • Grid View
    • FAQ
  • KPI
    • Introduction
    • Get Started
    • Format Pane
    • Edit Mode - Introduction
      • KPI Charts
        • Advanced Text
        • Bar Chart
        • Lollipop Chart
        • Line Chart
        • Area Chart
        • Combo Chart
        • Donut Chart
        • Pie Chart
        • Linear Gauge
        • Liquid Gauge
        • Radial Gauge
        • Bullet Chart
        • Waterfall Chart
        • Icon
        • Image
        • Shape
      • Templates
      • Small Multiples
      • Actions
      • Import/Export
  • Activity Gauge
    • Introduction
    • Get Started
    • Format Pane
    • Advance settings: Introduction
      • Gauge Options
      • Target
      • Data Colors
      • Fill Patterns
      • Labels
      • Ranking
      • Sorting
      • Center Circle
      • Mouse Over Text
      • Conditional Formatting
      • Show Condition
      • Grid View
      • Annotations
  • Funnel Chart
    • Introduction
  • Horizon Chart
    • Introduction
  • Ridgeline Plot
    • Introduction
  • Rose/ Donut/Pie Chart
    • Introduction
  • Word Cloud
    • Introduction
    • Get Started
    • Format Pane
    • Advanced Settings: Introduction
      • Word Options
      • Data Colors
      • Shapes
      • Text Style
      • Direction
      • Ranking
      • Exclude
      • Conditional Formatting
      • Show Condition
      • Grid View
      • Lasso and Reverse Lasso
  • Linear Gauge
    • Introduction
  • Filter
    • Introduction
    • Get Started
    • Format Pane
    • Advanced Settings - Introduction
      • Filter Settings
      • Cell Style
      • Cell Colors
      • Title Bar
      • Column Headers
      • Image Styling
      • Default Selection
      • Conditional Formatting
      • Import/Export
      • Templates
  • Lollipop Chart
    • Introduction
  • Heatmap
    • Introduction
    • Get Started
    • Format Pane
    • Advanced Settings: Introduction
      • Shapes
      • Data Colors
      • Data Labels
      • Axis Settings
      • Grid Lines
      • Sorting
      • Plot Area
      • Reference Lines
      • Ranking
      • Totals
      • Small Multiples
      • Conditional Formatting
      • Show Condition
      • Grid view
      • Lasso and Reverse Lasso
  • Network Graph
    • Introduction
  • Sankey Chart
    • Introduction
Powered by GitBook
On this page
  • Steps to apply conditional formatting​
  • Measure Rule​
  • Category Rule​
  1. Sunburst
  2. Advanced Settings: Introduction

Conditional Formatting

PreviousLeaf Label ImagesNextShow Condition

Last updated 11 months ago

Conditional formatting lets you change the color of arcs based on rules. You can create multiple rules based on the category or measure fields.

Steps to apply conditional formatting

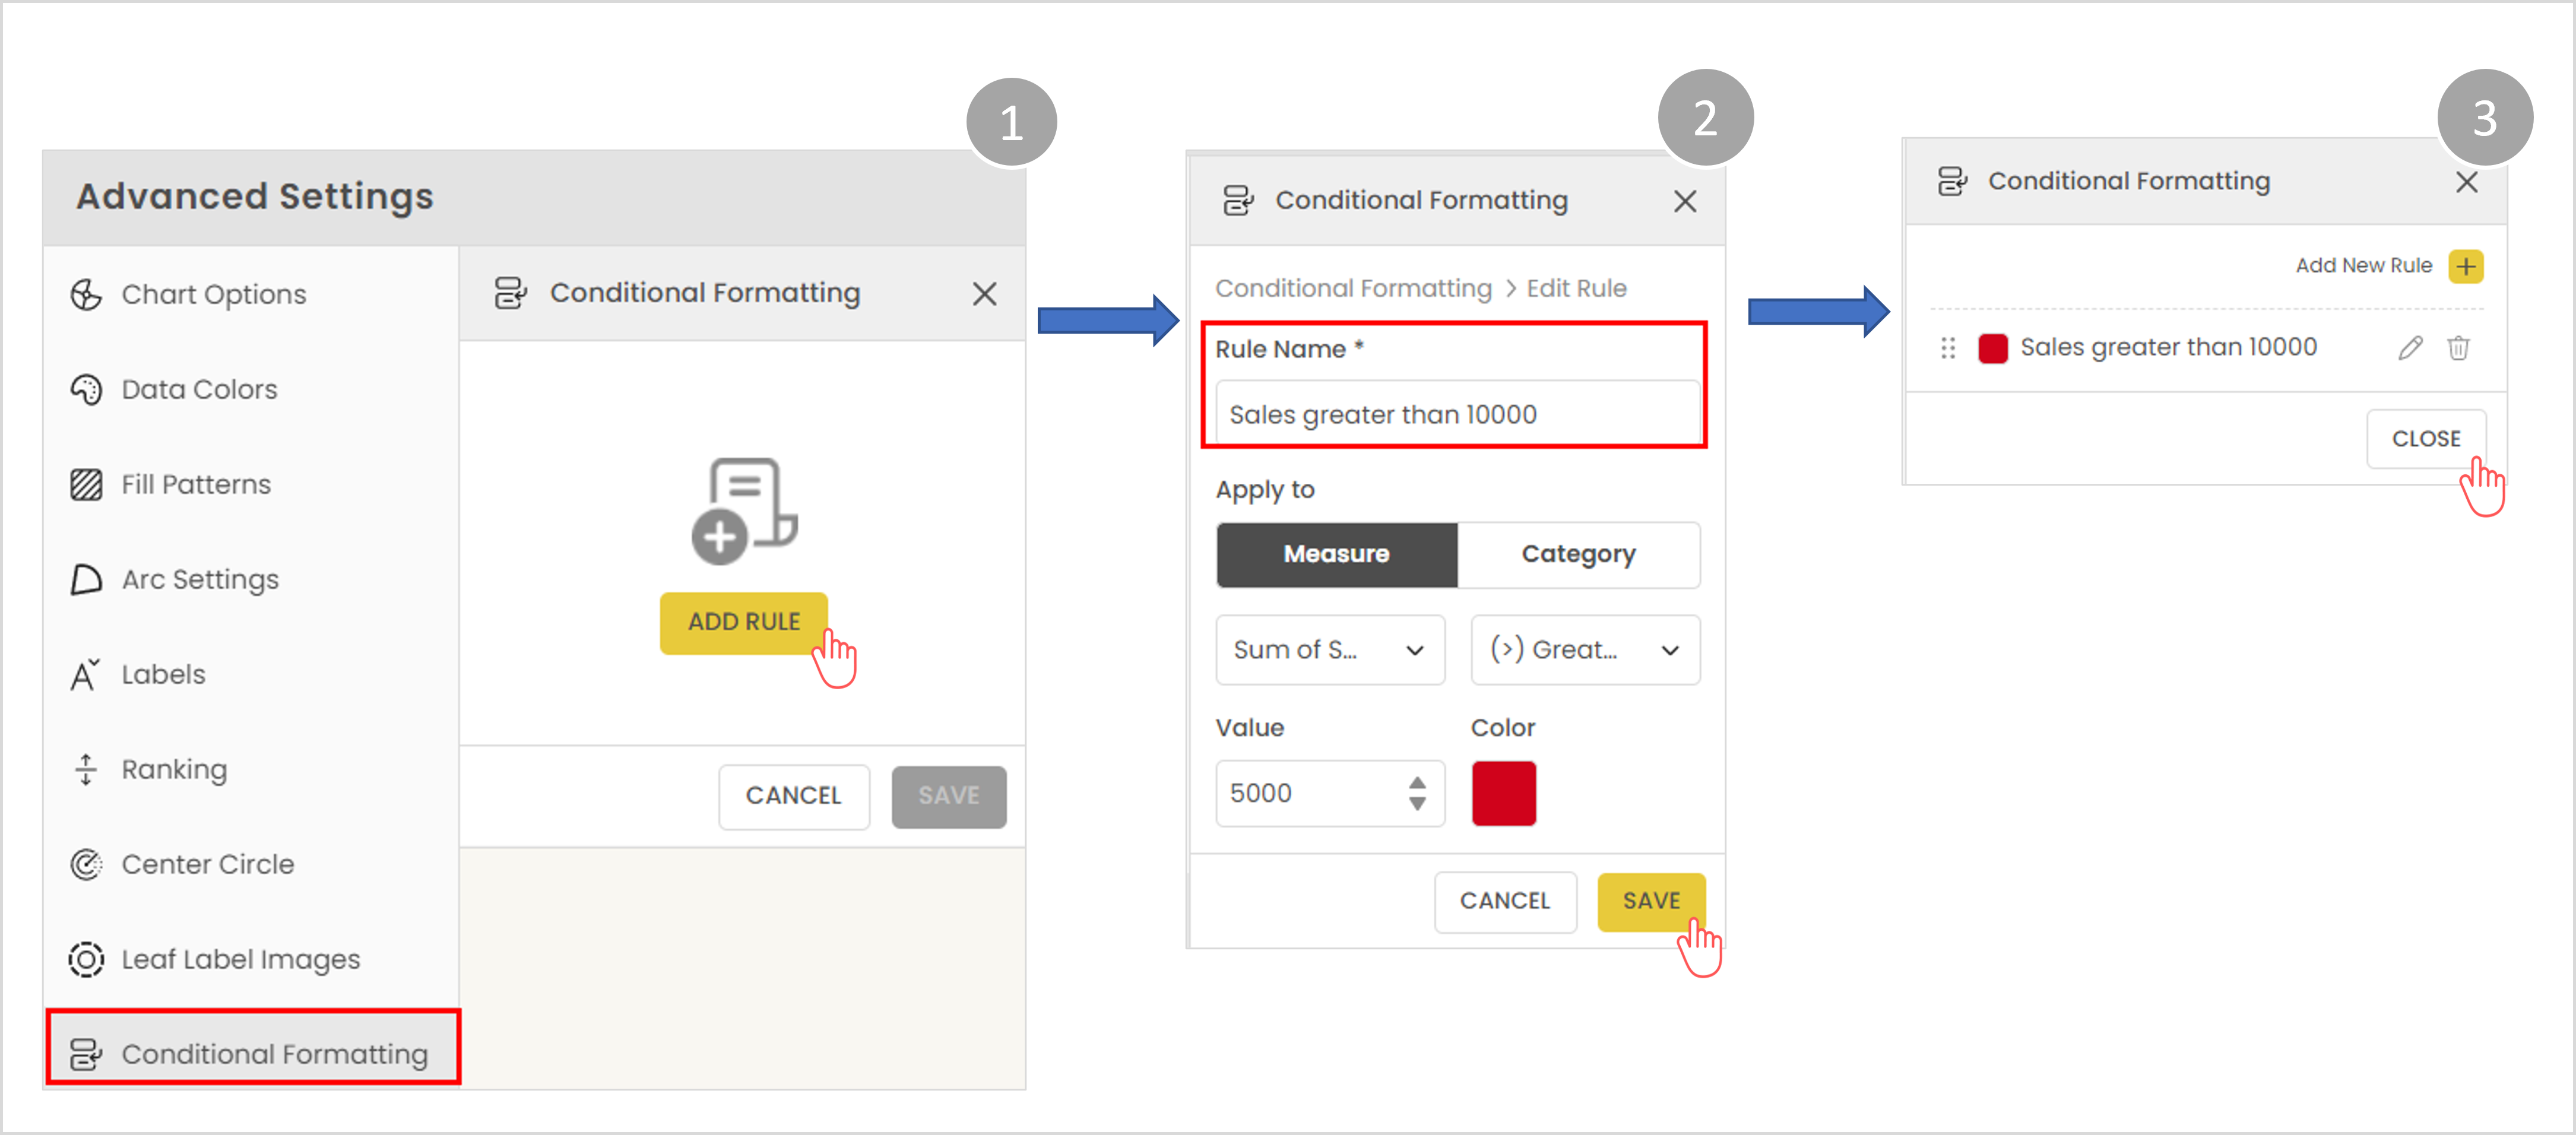
  1. Go to conditional formatting, using advanced settings.

  2. Click on the “Add Rule” button.

  3. Rule name is mandatory to have.

  4. Apply a rule by measure or category.

  5. Pick the column from the drop-down menu.

  6. Create a condition and select the custom color.

  7. Hit Save, to apply.

Result: If the conditions are met, the colors of the arcs will change.

INFO

  • You can re-order, edit, or delete existing rules.

  • If two rules are true for the same arc. The color of the rule at the top of the list will be applied.

You can set rules based on any numeric value in this section. Measure field and tooltip aggregated values can be used to apply conditions. Measure rules can be defined as equal to, not equal to, less than, greater than, less than equal to, greater than equal to, and between.

You can set rules based on the dimension added in the Category field. Select the hierarchy level and type the exact text of the node you wish to highlight. For categories, rules can be set by is, is not, begins with, does not begin with, ends with, does not end with, contains, does not contain.

Tutorial

Gif

Measure Rule

Category Rule

​
​
​
​