Powerviz
  • Introduction
  • Installation Guide
    • Install from Appsource
    • Import through file
    • Adding the Powerviz visuals as Organization visuals
  • Date Picker
    • Introduction
    • Get Started
    • Format Pane
    • Advanced Settings: Introduction
      • Calendar
      • Formatting
      • Date Picker Button
      • Default Selection
      • Date Selector
      • Presets
      • Selection Controls
      • Date Range
      • Invalid Dates
      • Weekends/Holidays
    • Themes
      • Default Theme
      • Custom Theme
  • Sunburst
    • Introduction
    • Get Started
    • Format Pane
    • Advanced Settings: Introduction
      • Chart Options
      • Data Colors
      • Fill Patterns
      • Arc Settings
      • Labels
      • Sorting
      • Ranking
      • Center Circle
      • Leaf Label Images
      • Conditional Formatting
      • Show Condition
      • Annotations
      • Grid View
    • FAQ
  • KPI
    • Introduction
    • Get Started
    • Format Pane
    • Edit Mode - Introduction
      • KPI Charts
        • Advanced Text
        • Bar Chart
        • Lollipop Chart
        • Line Chart
        • Area Chart
        • Combo Chart
        • Donut Chart
        • Pie Chart
        • Linear Gauge
        • Liquid Gauge
        • Radial Gauge
        • Bullet Chart
        • Waterfall Chart
        • Icon
        • Image
        • Shape
      • Templates
      • Small Multiples
      • Actions
      • Import/Export
  • Activity Gauge
    • Introduction
    • Get Started
    • Format Pane
    • Advance settings: Introduction
      • Gauge Options
      • Target
      • Data Colors
      • Fill Patterns
      • Labels
      • Ranking
      • Sorting
      • Center Circle
      • Mouse Over Text
      • Conditional Formatting
      • Show Condition
      • Grid View
      • Annotations
  • Funnel Chart
    • Introduction
  • Horizon Chart
    • Introduction
  • Ridgeline Plot
    • Introduction
  • Rose/ Donut/Pie Chart
    • Introduction
  • Word Cloud
    • Introduction
    • Get Started
    • Format Pane
    • Advanced Settings: Introduction
      • Word Options
      • Data Colors
      • Shapes
      • Text Style
      • Direction
      • Ranking
      • Exclude
      • Conditional Formatting
      • Show Condition
      • Grid View
      • Lasso and Reverse Lasso
  • Linear Gauge
    • Introduction
  • Filter
    • Introduction
    • Get Started
    • Format Pane
    • Advanced Settings - Introduction
      • Filter Settings
      • Cell Style
      • Cell Colors
      • Title Bar
      • Column Headers
      • Image Styling
      • Default Selection
      • Conditional Formatting
      • Import/Export
      • Templates
  • Lollipop Chart
    • Introduction
  • Heatmap
    • Introduction
    • Get Started
    • Format Pane
    • Advanced Settings: Introduction
      • Shapes
      • Data Colors
      • Data Labels
      • Axis Settings
      • Grid Lines
      • Sorting
      • Plot Area
      • Reference Lines
      • Ranking
      • Totals
      • Small Multiples
      • Conditional Formatting
      • Show Condition
      • Grid view
      • Lasso and Reverse Lasso
  • Network Graph
    • Introduction
  • Sankey Chart
    • Introduction
Powered by GitBook
On this page
  • Step to apply data colors​
  • Single​
  • Power BI Theme​
  • Gradient​
  • By Category​
  • Sequential​
  • Diverging​
  • Qualitative​
  • More options​
  1. Sunburst
  2. Advanced Settings: Introduction

Data Colors

PreviousChart OptionsNextFill Patterns

Last updated 7 months ago

The data colors options allow you to add a wide range of color schemes on your visual. Powerviz gallery includes 7 color schemes and over 30 palettes. You can choose from the palettes or create your own. Changing these colors won’t affect any other visual or Power BI theme.

Step to apply data colors

To get started,

  1. Open the Data Colors option using the “⚙️” advanced settings panel.

  2. Select a “Color Palette” from the dropdown.

  3. Based on the scheme, pick the color. Hit Apply to save.

    Gif

Data colors have seven color schemes:

Single scheme color all the arcs in the sunburst with the same color.

TIP

Use a single scheme with conditional formatting, it will reduce the visual noise and help you find the outliers.

Preview

The Power BI theme refers to the theme that applies to the entire PBIX report. You can use the same color scheme on the Sunburst visual as well.

Preview

The gradient scheme colors each node based on its value. You can choose the max, mid, and min colors. This gradient will apply to each level of the hierarchy, where the highest value will have the maximum color and the lowest the minimum color.

Preview

Using the by-category scheme, you can choose one fill color for each parent node. This color will be applied to the entire category.

INFO

When the "show remaining as - others" arc is enabled. You'll get a color picker for it as well.

If the number of parent categories increases because of new data or filters, the default color for them is black. The user needs to go into settings and pick the color for it.

Preview

Sequential schemes go from the lightest to the darkest shade of the same color. The lightest color represents the lowest value, while the darkest color represents the highest value.

In Sequential scheme, we offer over 15 color palettes with colors like blue, yellow, green, and more.

Preview

Diverging color schemes refer to a mix of two or three shades of color that are very different from each other. It helps in dividing the data into categories using color. Some popular examples are traffic light colors (red-orange-green) and beach colors (blue-brown).

In a diverging scheme, we offer colorblind-safe palettes as well. Enable the checkbox "Show color blind safe palettes only" to filter out the list.

Preview

Enable the checkbox “Show colorblind-safe palettes only” to filter out the palettes.

CAUTION

Use up to five categories per level to keep them colorblind-safe. More colors will reduce their chance of being accessible.

Preview

Apart from the above-mentioned schemes, data colors offer three more additional features:

Add-on feature
Action
Example/ Images

Reverse Colors

Reverse the order of the color palette. Interchange the max and min colors.
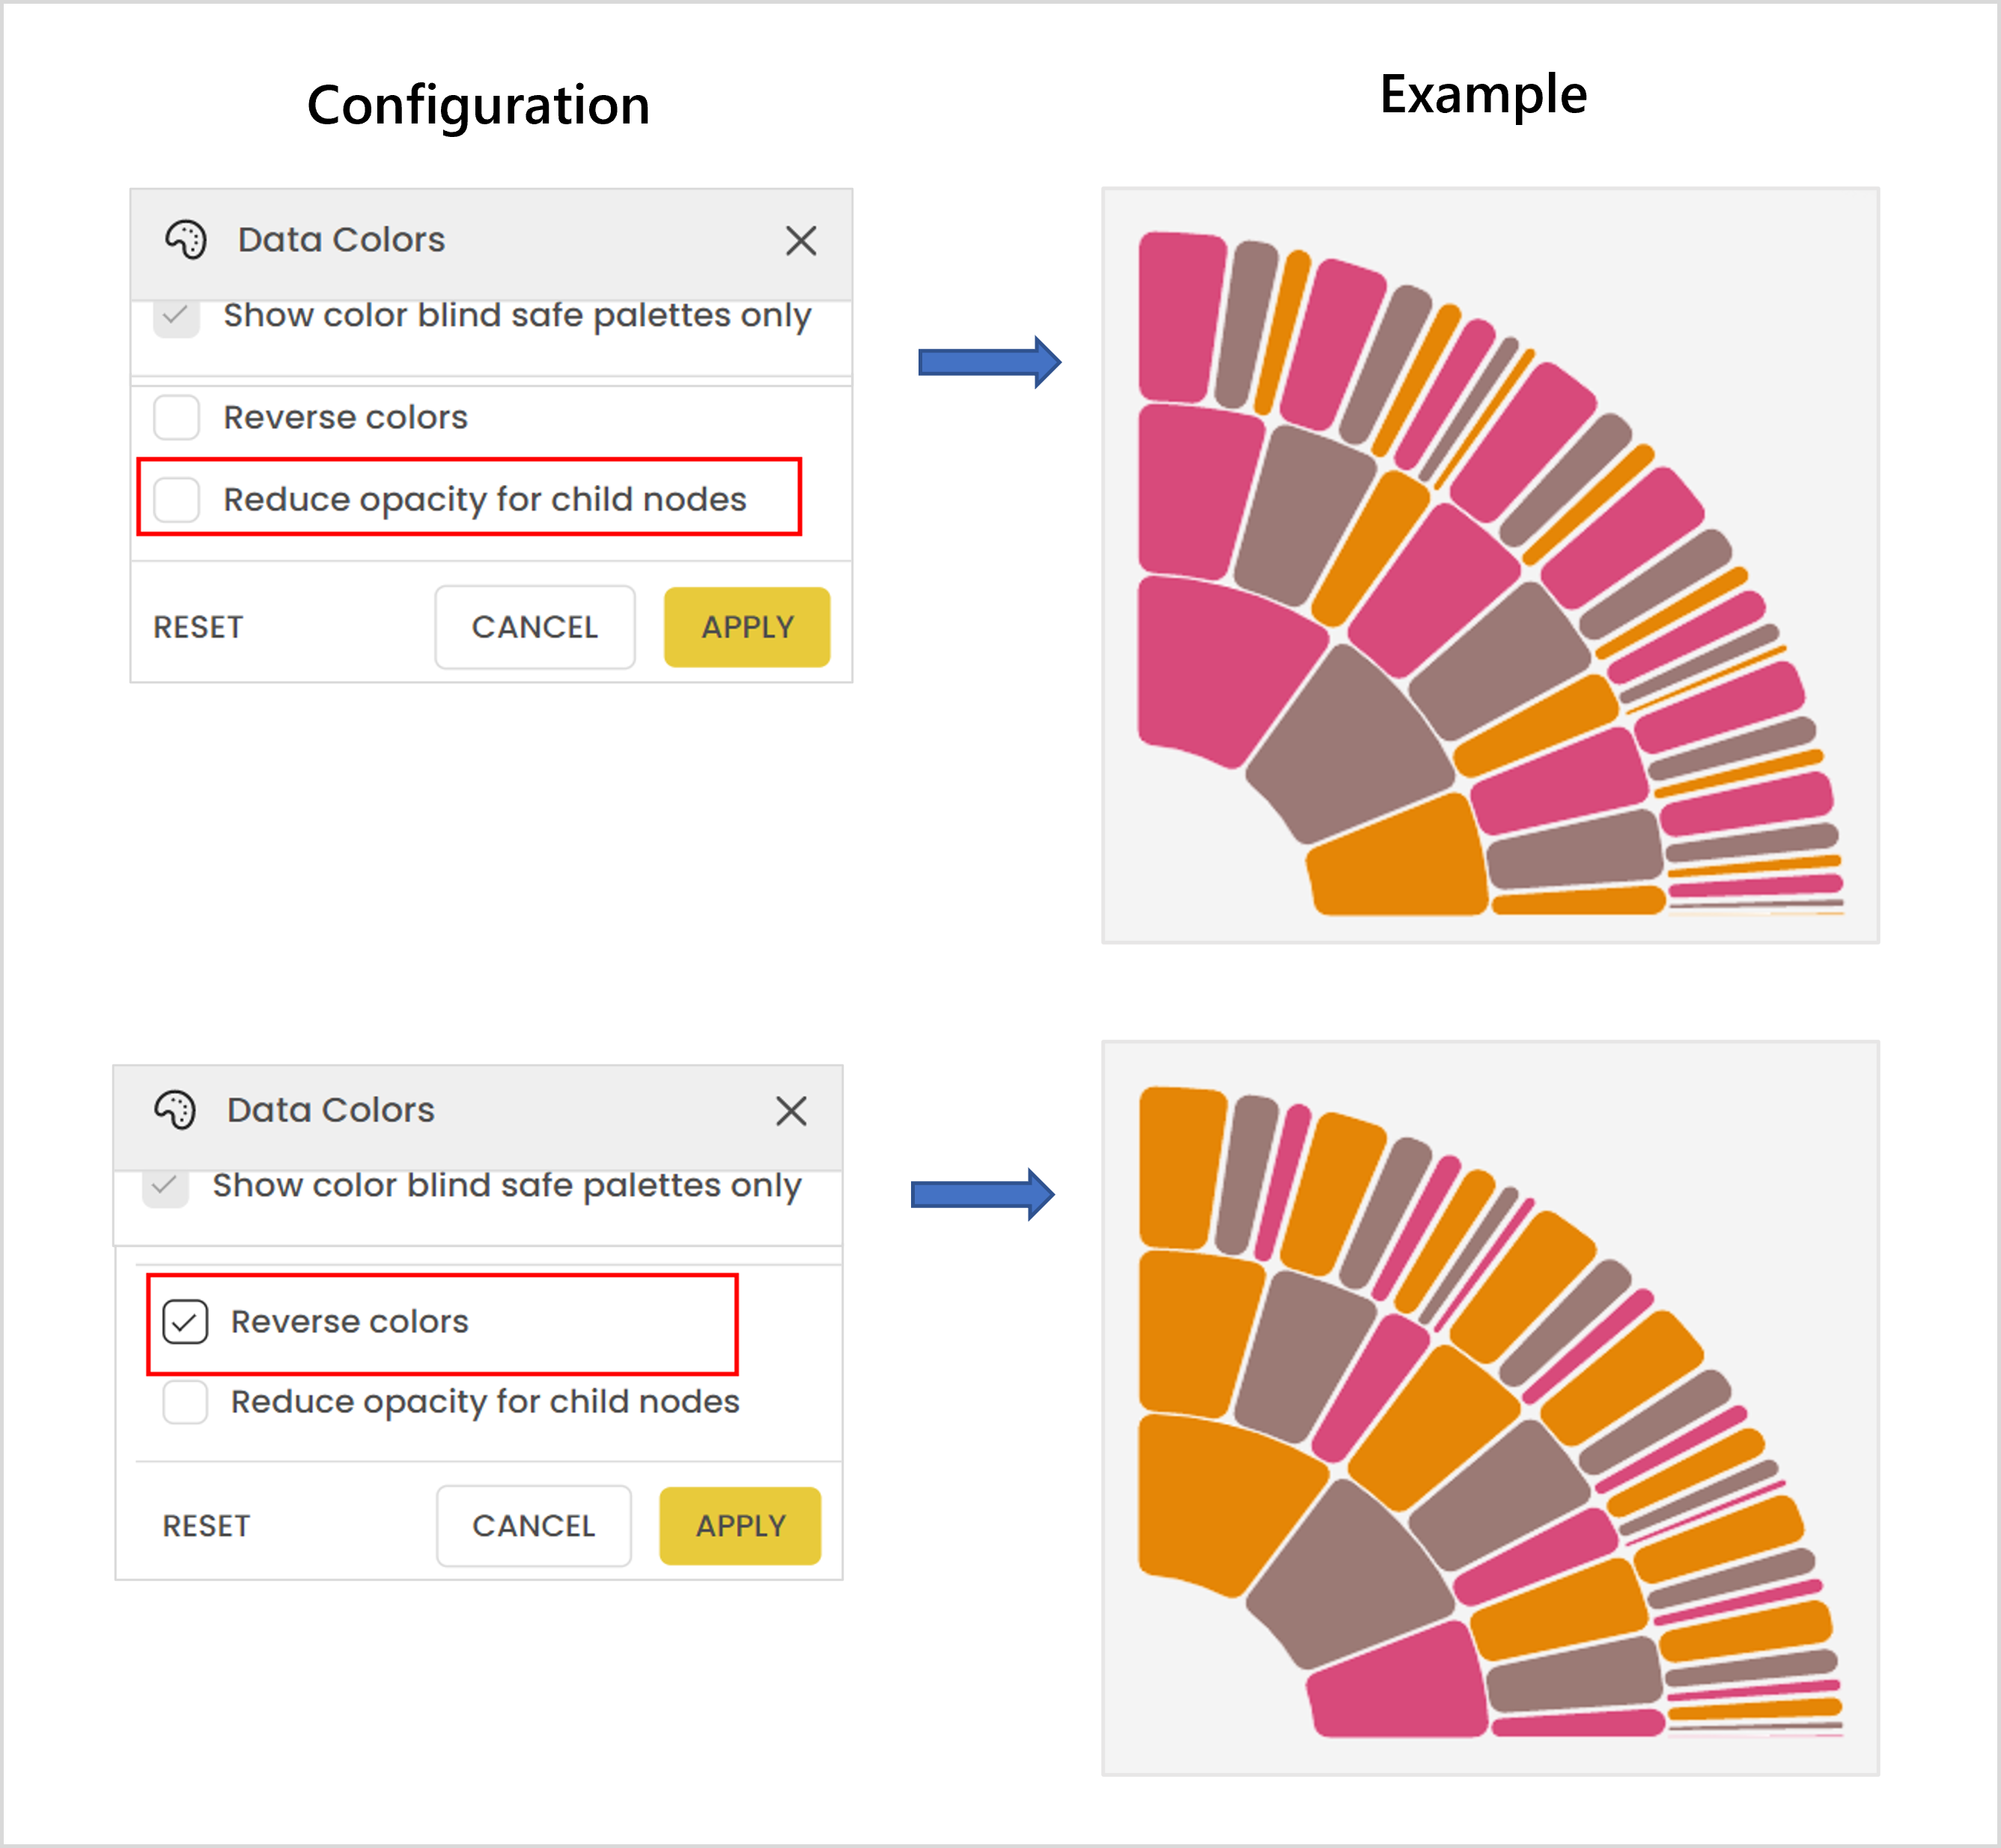
Reduce opacity for child nodes

Reduce the opacity on each level compared to its previous level.
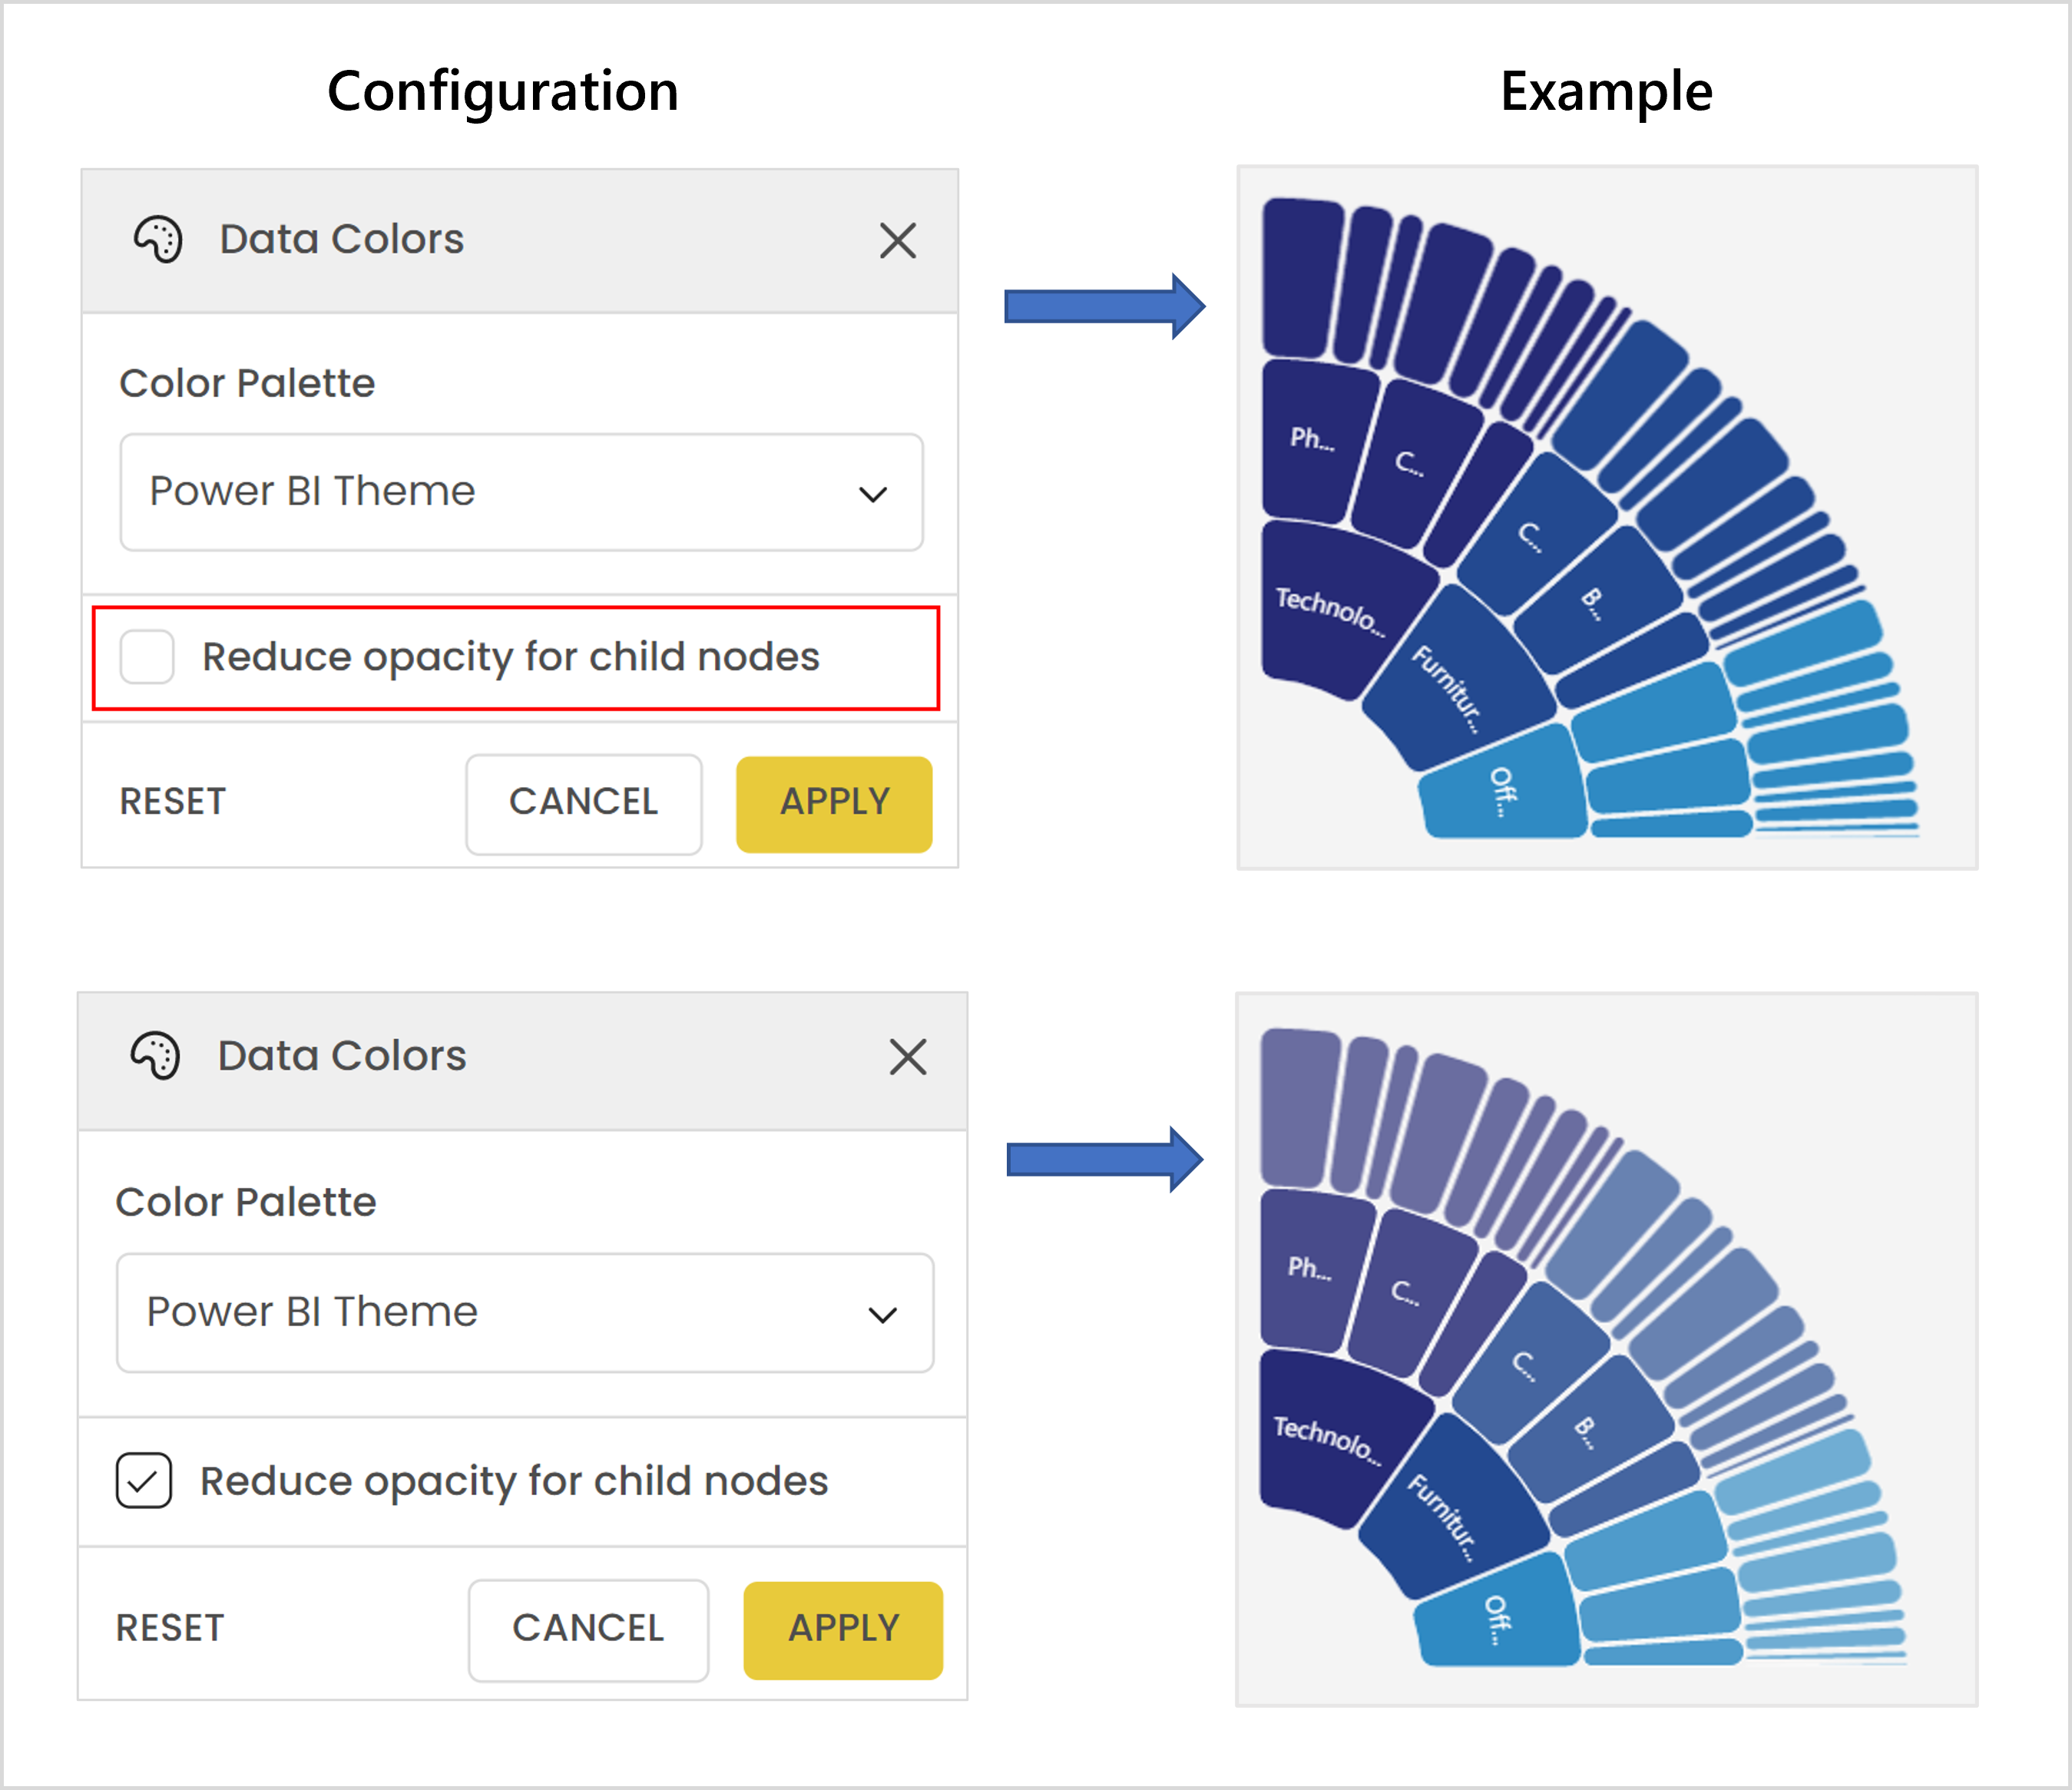
Customize others color

Pick a custom color for “others”. You’ll get this checkbox when the Ranking “show remaining as - others” is enabled.
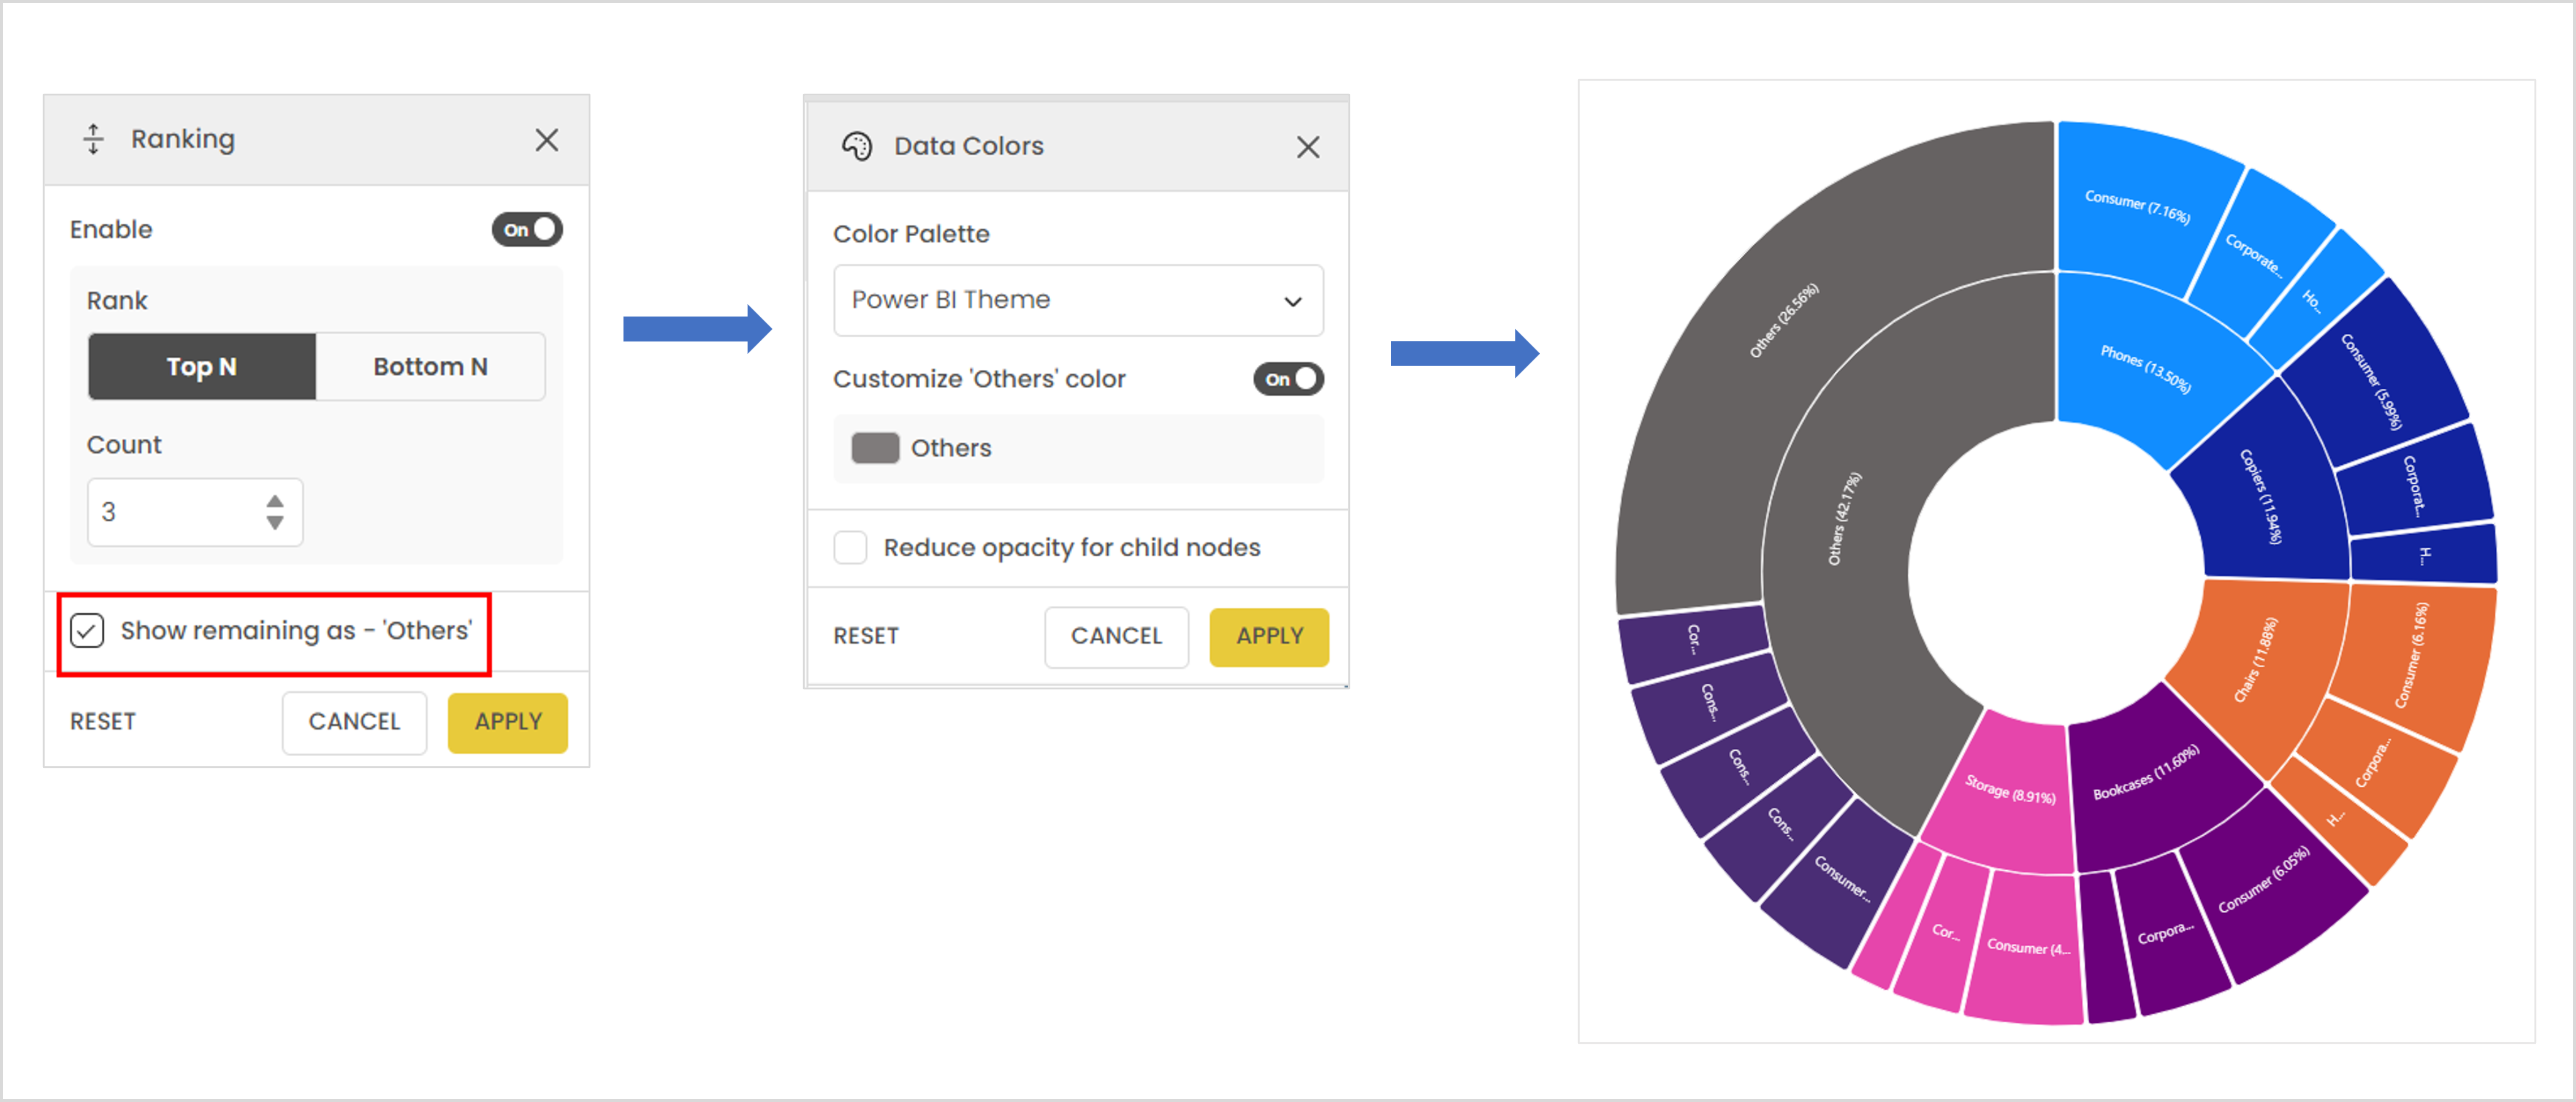
1.

2.

3.

4.

5.

6.

7.

Single

Power BI Theme

To know more about .

Gradient

By Category

Sequential

Diverging

Qualitative

Unlike and , the qualitative schemes have different colors and hues to highlight multiple sections. It is a mix of different color contrasts. You can generally see qualitative palettes being used in painting.

More options

​
​
Power BI themes
​
​
​
​
​
​
Single
Power BI Theme
Gradient
By Category
Sequential
Diverging
Qualitative
Diverging
Sequential
​