> For the complete documentation index, see [llms.txt](https://docs.powerviz.ai/powerviz/llms.txt). Markdown versions of documentation pages are available by appending `.md` to page URLs; this page is available as [Markdown](https://docs.powerviz.ai/powerviz/date-picker/advanced-settings-introduction/weekends-holidays.md).
# Weekends/Holidays
Use this option to control formatting for weekends and holidays. There are two tabs for both sections.
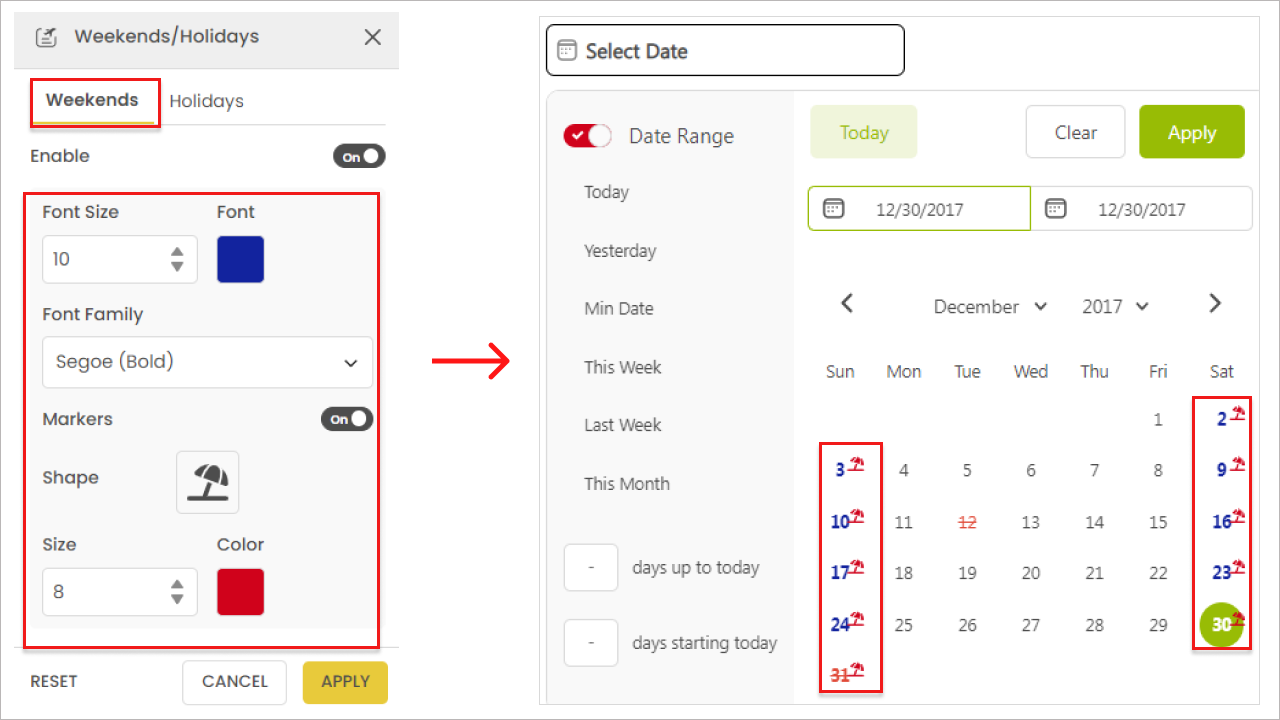
### Weekend[](https://docs.powerviz.ai/datepicker/advanced-settings/weekends-holidays#weekend)
Use the weekend formatting option to customize how weekends (Saturdays and Sundays) are displayed in the date picker.
* The Weekends option change the font size, family, and color.
* You can also choose to show icons on weekend dates. Simply enable the marker and select the icon shape, color, and size.
### Holidays[](https://docs.powerviz.ai/datepicker/advanced-settings/weekends-holidays#holidays)
Holidays are different from weekends as they can occur on any date in the calendar. With Powerviz, you have the flexibility to control how holidays are displayed and highlight important dates or events for your organization.
#### How to enable holidays?[](https://docs.powerviz.ai/datepicker/advanced-settings/weekends-holidays#how-to-enable-holidays)
Use the below steps to add a custom holiday column.
1. Create a column or measure in your data.
* Use a 0/1 condition, where 1 represents true and 0 represents false.
* This column can be created in your source data, Power Query Editor, Calculated Column, or using DAX formula.
{% code title="DAX Measure Example" %}
```dax
VAR _date = MIN('Date'[Date])
VAR Result =
IF(_date = BLANK(), BLANK(),
SWITCH(TRUE(),
_date = DATE(2022, 12, 10), 1, // 1 for true dates
_date = DATE(2022, 01, 22), 1,
0) // 0 for false dates
)
RETURN
Result
```
{% endcode %}
* Refer to this link for information on [adding a custom column](https://docs.microsoft.com/en-us/power-bi/create-reports/desktop-add-custom-column).
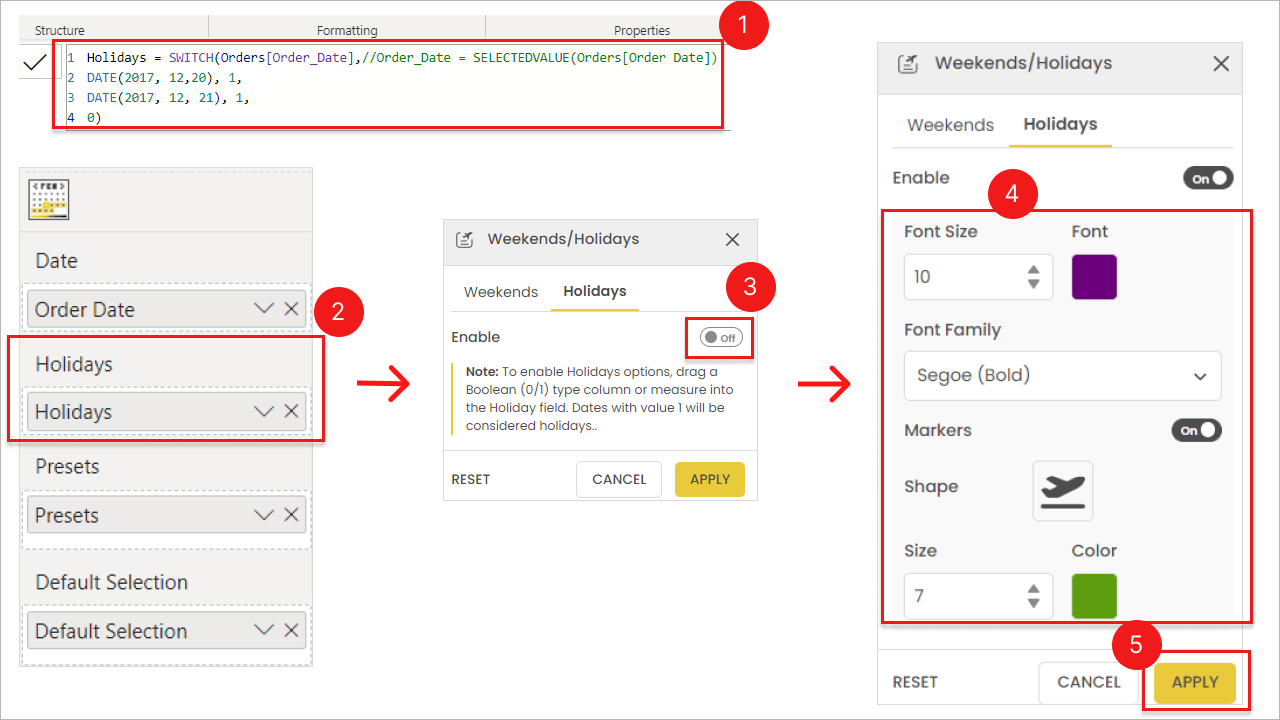
2. Drag the custom column into the holidays field.
* Ensure that the column is of numeric type.
* If it's a column, choose either MIN or MAX as the aggregation type.
3. Go to advanced settings and enable holidays.
4. Hit apply.
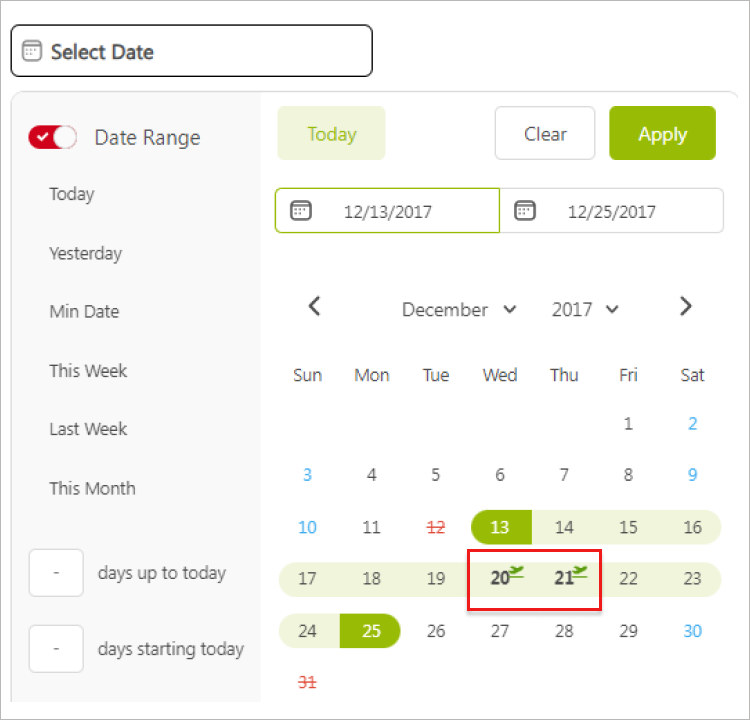
5. Result: Holiday dates are highlighted.
By default, holidays will appear in the below format.
**Holidays setting include:**
1. Control the `font size, color, and family`.
2. Enable the `Marker` to choose icon shape, color, and size.
3. The date picker has over `2000 icons` to choose from.